After months of meticulous work, we are happy to present DHTMLX Gantt 9.0. This milestone release makes the interface of our JavaScript Gantt chart shine with new colors. Version 9.0 brings overhauled themes and significantly simplifies the look and feel customization of your Gantt charts. We’ve also introduced manually scheduled summary tasks, built-in support for baselines, enhanced visualization of deadlines and constraints, sticky labels, and numerous other improvements to boost web applications based on our Gantt component.
In this post, we’ll go over the new features and improvements that make DHTMLX Gantt 9.0 a must-have tool in tech stacks used for delivering comprehensive project management apps.
Customizable Themes and Enhanced UI
A visually appealing and easily customizable UI is crucial for satisfying the needs of both web developers and end-users. In DHTMLX Gantt 9.0, we’ve made significant strides in enhancing the UI to provide a more modern and flexible experience.
Overhauled Themes
Just like in the latest major update of DHTMLX Scheduler (v7.0), Gantt 9.0 brings a complete overhaul of themes. We’ve rewritten the core styles, adopting modern design practices to ensure your Gantt charts look fresh and trendy.
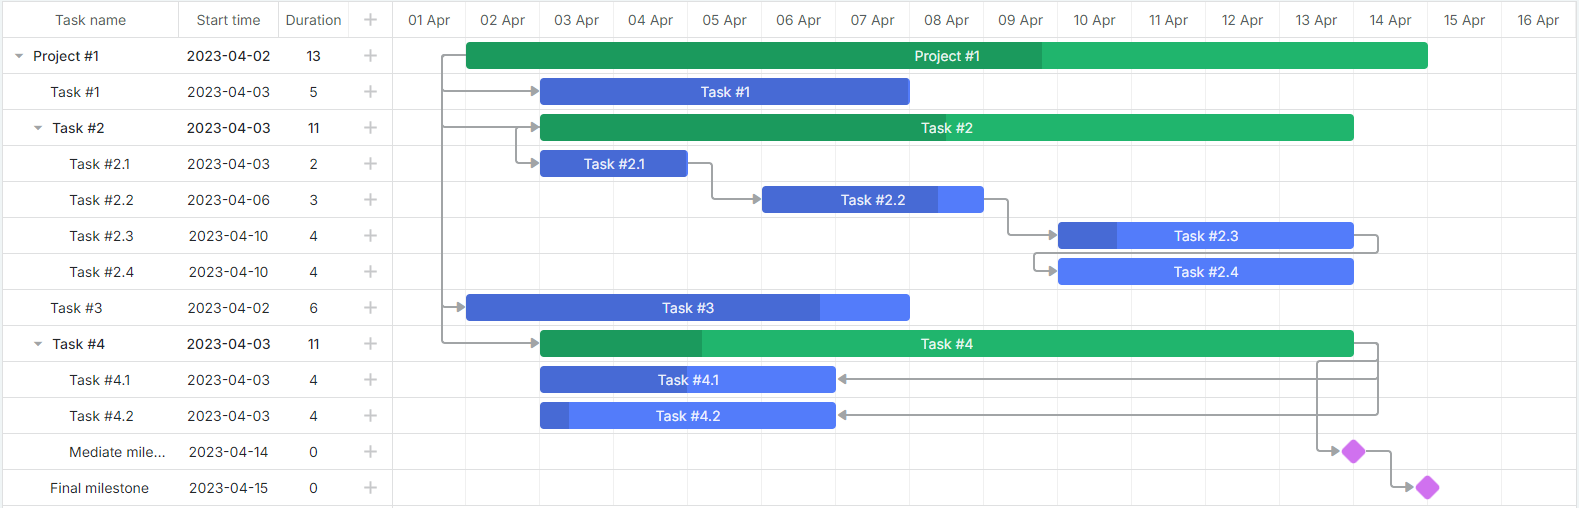
Updated Terrace Theme
The default Terrace theme has been revamped to align with modern UI standards. It now offers a cleaner, more vibrant appearance that enhances readability and user engagement.
 Check the sample >
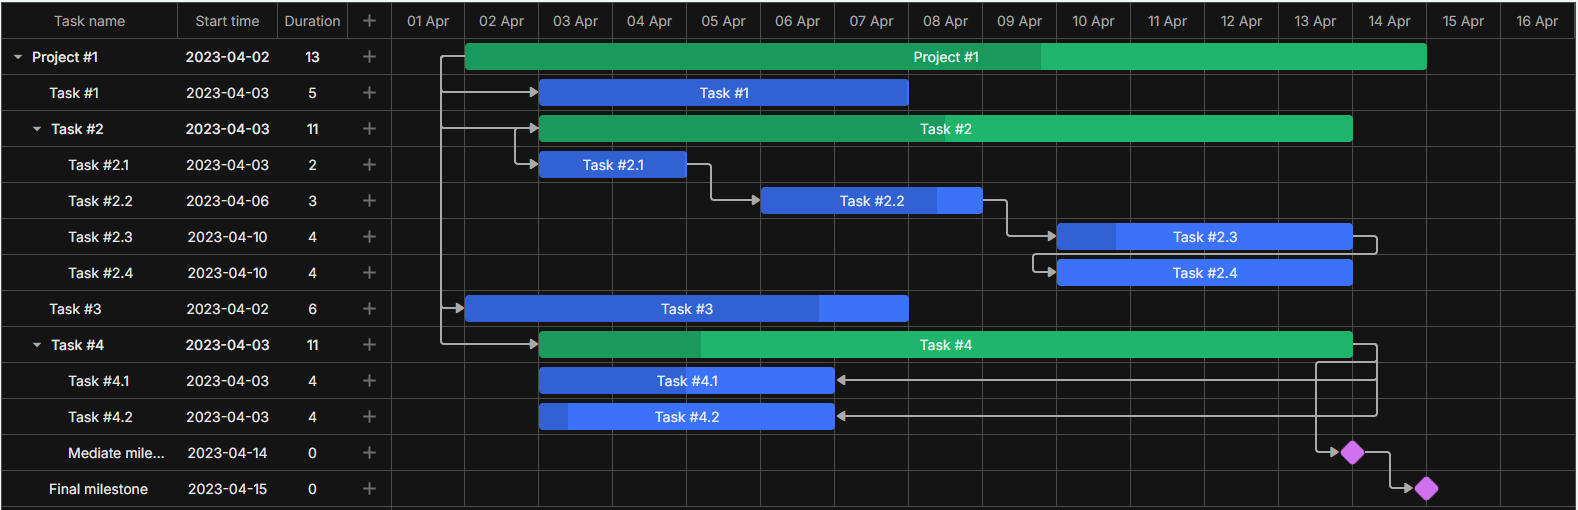
New Dark Theme
The demand for a Dark theme in web apps continues to be high, and there are many reasons for such popularity. Dark themes reduce eye strain and give your applications a sleek, modern look. Using v9.0, you can apply this popular theme to your Gantt projects.
 Check the sample >
Gantt Customization with CSS Variables
Another standout styling feature included in v9.0 is simplified Gantt customization using CSS variables. These custom properties provide multiple benefits, as reviewed below in more detail.
Easy Customization and Maintenance
CSS variables provide an easy and flexible way to modify the Gantt appearance. Web developers can define global style properties such as colors, fonts, and other styling elements, allowing quick updates across the entire Gantt chart with just a few changes.
The following piece of code allows changing the color of scales, tasks, and links in the Gantt chart:
/* scales */
--dhx-gantt-scale-background: #8E8E8E;
--dhx-gantt-base-colors-border-light: #C5C5C5;
--dhx-gantt-base-colors-border: #DFE0E1;
--dhx-gantt-scale-color: #FFF;
--dhx-gantt-base-colors-icons: #00000099;
/* tasks */
--dhx-gantt-task-background: #3db9d3;
--dhx-gantt-task-color: #FFFFFF;
--dhx-gantt-project-background: #6AA84F;
--dhx-gantt-project-color: #FFFFFF;
/* links */
--dhx-gantt-link-background: #ffa011;
--dhx-gantt-link-background-hover: #ffa011;
}
Any change to a variable, such as adjusting a primary color, will apply uniformly across the entire UI, keeping everything in sync. This also reduces the complexity and effort needed to maintain or update the UI over time.
Theme Customization with CSS Variables
CSS variables also offer an opportunity to simplify the customization of existing Gantt themes. Thus, the UI becomes more adaptable to theme changes based on user preferences or specific project needs.
Moreover, v9.0 makes it possible for end-users to switch between themes via app settings without the page reloading. Using this sample, you can try this feature in action.
The dynamic theme switching is implemented using the setSkin() method.
For those who require extensive Gantt modifications, the v9.0 package includes themes’ source files. It enables deep customization and rebuilding of themes to meet specific requirements.
Learn more about theme customization options in the corresponding section of our documentation.
Icons Customization
In the new Gantt version, all icons are built with web fonts or SVG elements. It means you can customize icon styles directly through CSS variables, ensuring consistency across your application.
For instance, here is the way to change the size and color of the “plus” icon used for adding new tasks:
--dhx-gantt-base-colors-icons: #25C79D;
font-size: 18px;
}
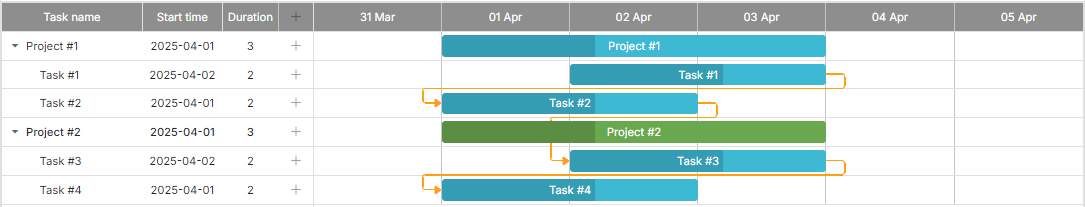
New Link Styling Option
We’ve also improved the way links are displayed between Gantt tasks. Now links can feature rounded borders, adding a smoother and more visually appealing connection between tasks. This is controlled by the new gantt.config.link_radius configuration option, where you can define the needed border radius for the links.
By increasing the radius value, the curves of the links become more pronounced. If you prefer the classic straight lines without any rounding, you can disable this feature by setting the radius to 1.
This novelty allows you to tailor the link styles to better match the application’s design aesthetics.
Manually Scheduled Summary Tasks
Our team always looks for ways to increase flexibility and accuracy in managing projects with Gantt charts. The new Gantt version is enriched with the manual summary (project) tasks scheduling feature. It serves to outline project phases before specifying subtasks details, providing a common project timeline.
By default, summary tasks automatically calculate their dates based on the earliest start and latest end dates of their subtasks. Now, end-users can set fixed start and end dates for summary tasks independently of their subtasks. As a result, the Gantt chart will display both the fixed duration of summary tasks and the duration derived from subtasks.
To activate this feature for a summary task, set the auto_scheduling property to false. The fixed dates are stored in task.start_date and task.end_date, while the computed dates from subtasks are available in task.$auto_start_date and task.$auto_end_date.
data: [
{
id: 1,
text: "Project Phase 1",
type: "project",
start_date: "2025-05-01 00:00:00",
duration: 15,
auto_scheduling: false
},
// ...
],
});
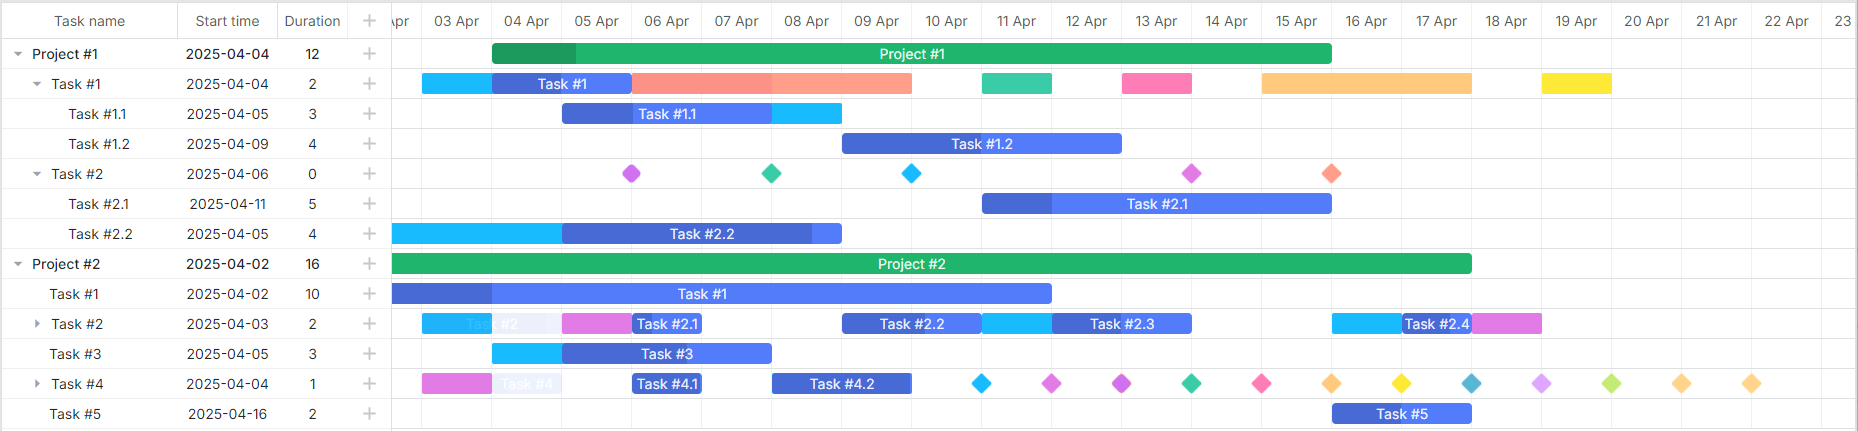
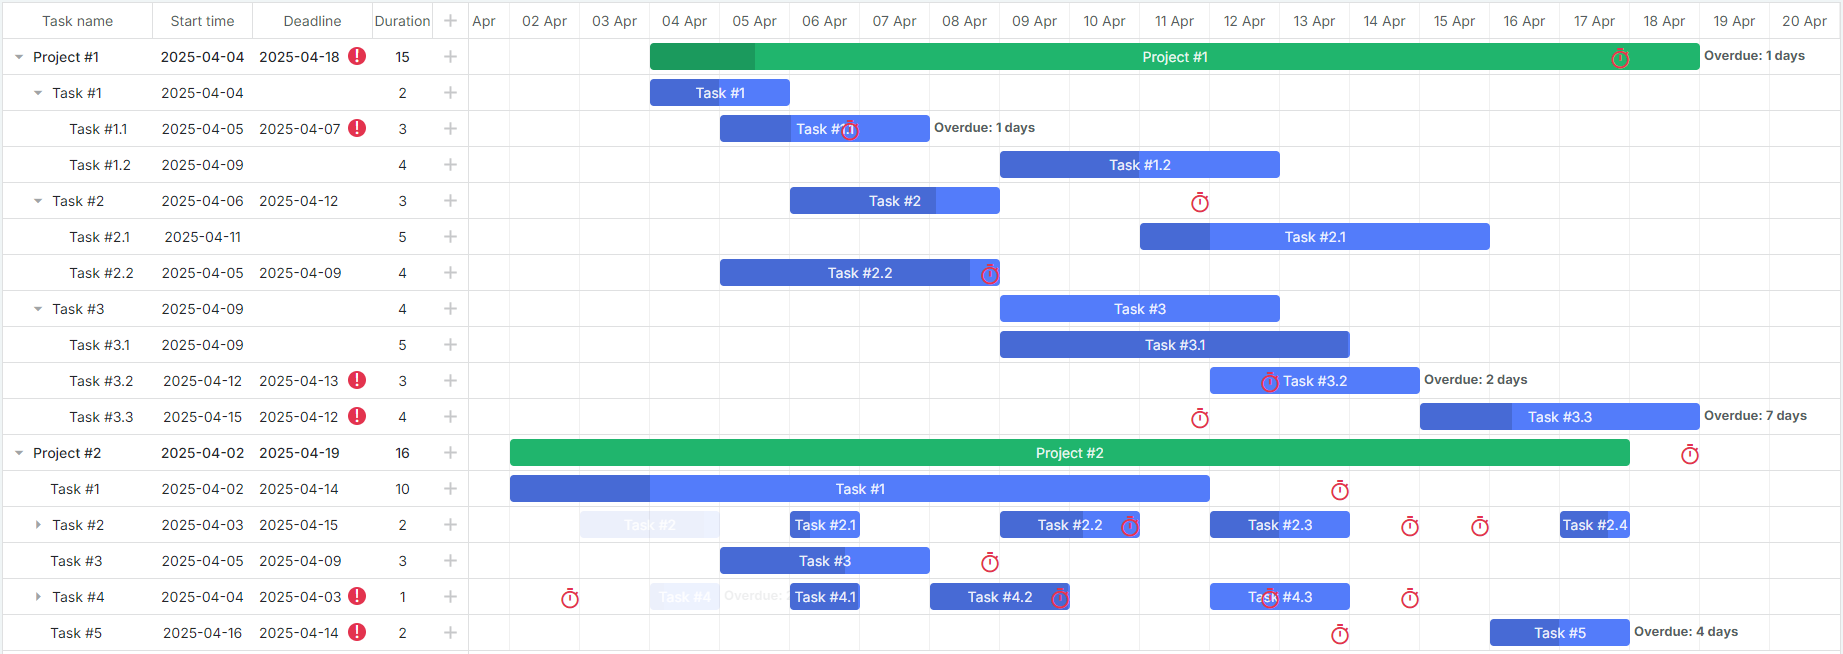
Both the fixed duration of the summary task and the actual duration calculated from its subtasks are displayed in the Gantt chart. If the subtask date range falls outside the assigned dates of the summary task, the summary task will be highlighted in red to indicate a scheduling conflict as in the example below. This visual cue helps end-users quickly identify and address discrepancies in the project timeline.
 Check the sample >
This feature gives end-users a handy mechanism for ensuring accurate project management even with unplanned schedule changes.
Built-in Support for Baselines
In tools like a Gantt chart, baselines give a clear idea of how the actual work progress aligns with the project implementation plan. Previously in DHTMLX Gantt, adding baselines required manual coding via the gantt.addTaskLayer API. From now on, developers can enjoy built-in support for baseline entities, greatly simplifying the work with this important Gantt item.
Baselines can be loaded directly alongside tasks, streamlining the presentation and management of Gantt data.
tasks: [
{
id: 2,
start_date: "2025-04-04 00:00:00",
duration: 2,
text: "Task #1",
progress: 0.5,
parent: 0,
open: true,
end_date: "2025-04-06 00:00:00",
},
// Additional tasks...
],
links: [],
baselines: [
{
id: 2,
task_id: 2,
start_date: "2025-04-03 00:00:00",
duration: 2,
end_date: "2025-04-05 00:00:00",
},
// Additional baselines...
],
});
Once baselines are loaded, Gantt will automatically display them in the timeline without any additional configuration like in this sample.
Managing baselines is now more intuitive with the new lightbox control. End-users can easily add, edit, or delete baselines directly from the task edit form.
This new control is specified as follows:
{ name: "description", height: 38, map_to: "text", type: "textarea", focus: true },
{ name: "time", type: "duration", map_to: "auto" },
{ name: "baselines", height: 100, type: "baselines", map_to: "baselines" },
];
Find more details on the new baseline capabilities in the documentation.
Flexible Baseline Rendering Modes
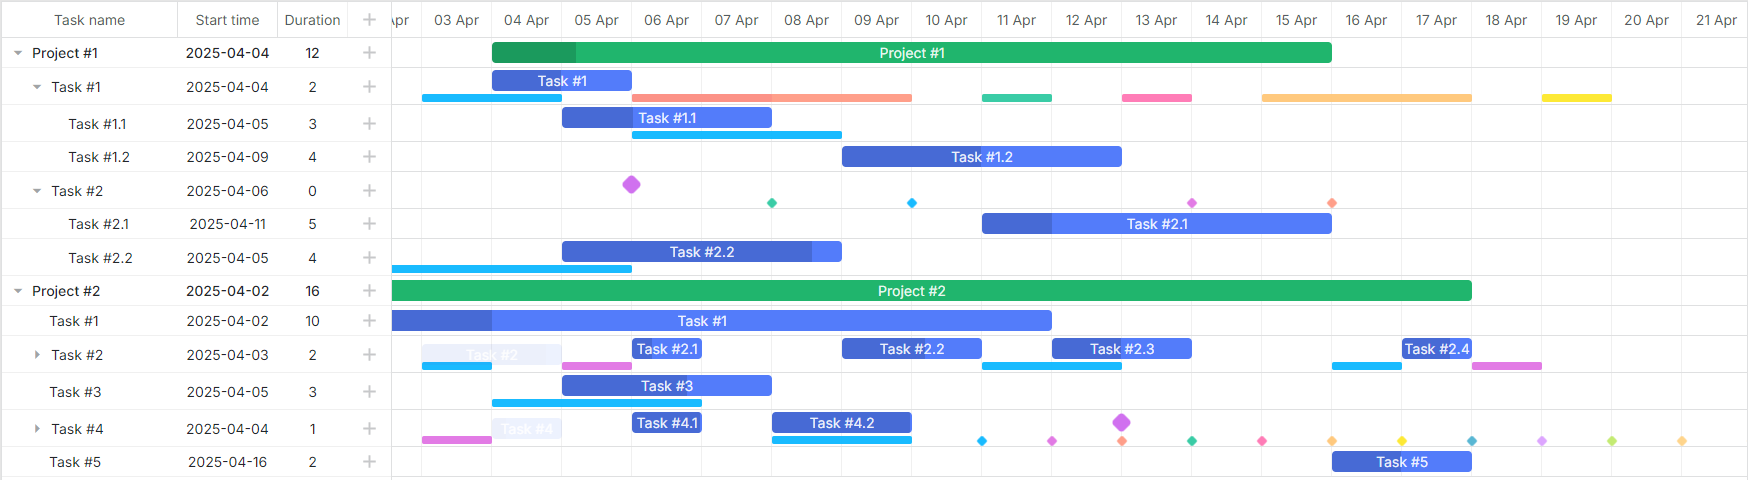
We understand that projects differ in workflow visualization needs. The new Gantt v9.0 offers three options for displaying baselines, controlled by the new gantt.config.baselines.render_mode configuration:
- Displaying baselines on the same row with tasks
If it is necessary to show baselines on the same row where there are task bars, this mode is specified as follows:
- Displaying baselines on separate subrows below tasks
To render all baselines on a single subrow below each task, enable the following mode:
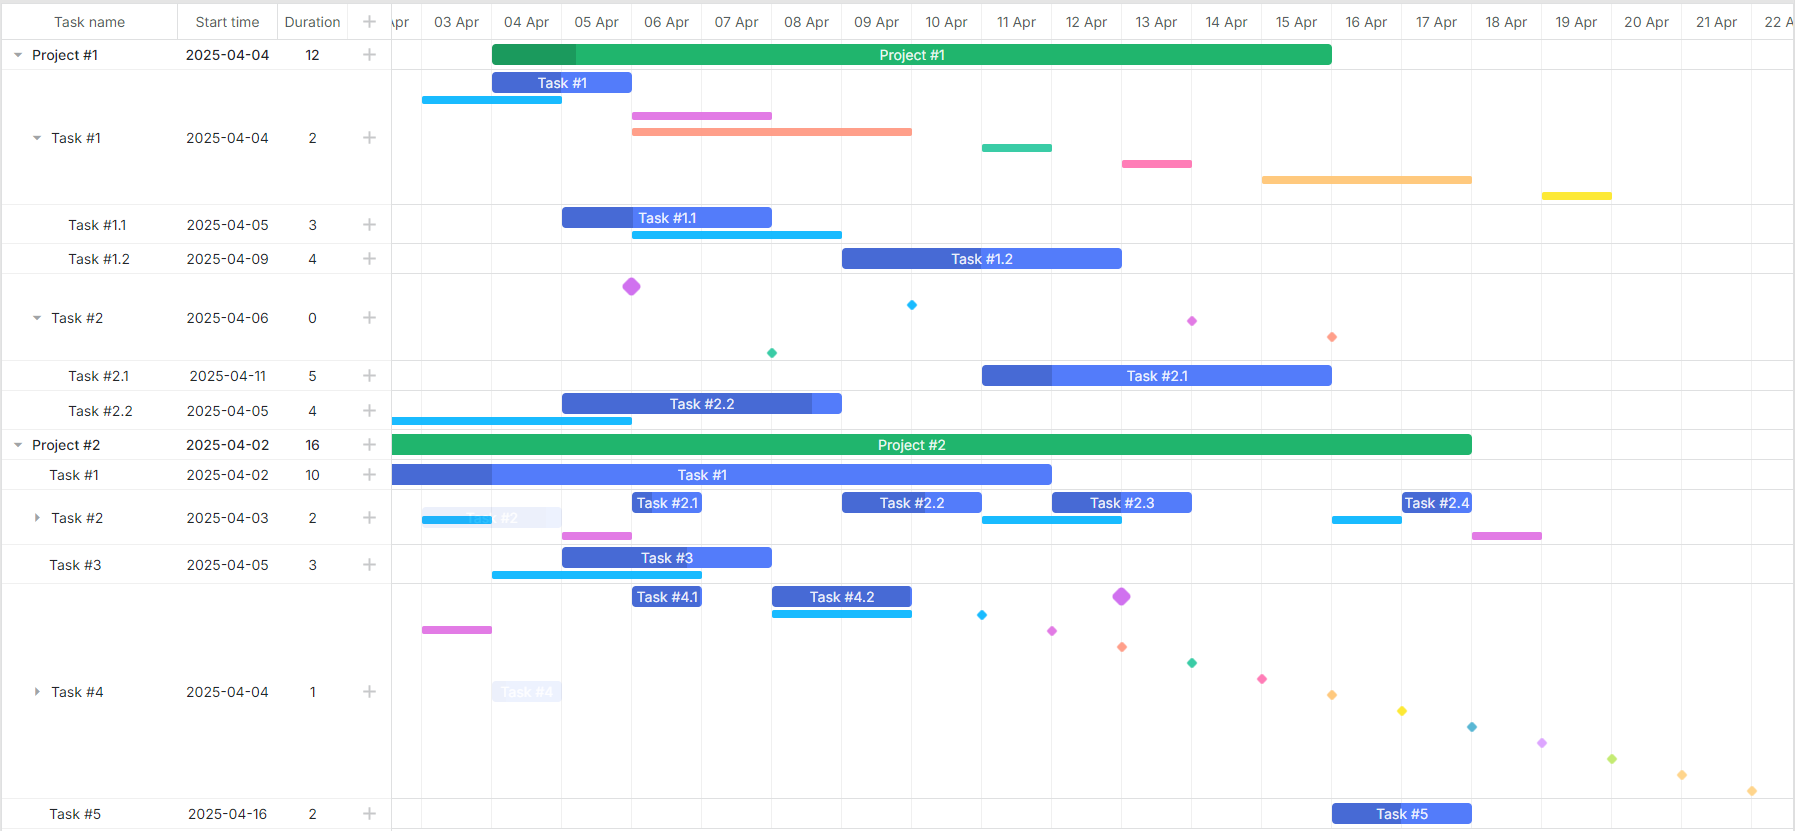
- Displaying individual subrows for each baseline
If you need a clearer view, individual subrows can be configured for showing baselines:
DataProcessor Support for Baselines
DHTMLX Gantt v9.0 introduces the DataProcessor support for baselines. From the technical perspective, when baselines are updated in the Gantt chart, changes are now automatically captured by the DataProcessor, ensuring seamless synchronization with the project’s backend.
switch (entity) {
case "baseline":
// Handle baseline updates
break;
// Handle other entities...
}
});
Built-in Display of Deadlines and Constraints
Tracking deadlines and understanding task constraints are vital for timely project delivery. DHTMLX Gantt 9.0 comes with built-in visualization for deadlines and constraints, enhancing end-users’ ability to manage project timelines effectively.
Deadlines Visualization
In version 9.0, our Gantt component starts to support the task.deadline field. When specified, it displays a visual indicator on the chart, thereby simplifying the tracking of task deadlines.
data: [
{
id: 1,
text: "Task with Deadline",
start_date: "2025-04-04",
duration: 5,
deadline: new Date(2025, 3, 10), // April 10, 2025
},
// Additional tasks...
],
});
Constraints Visualization in Auto Scheduling Mode
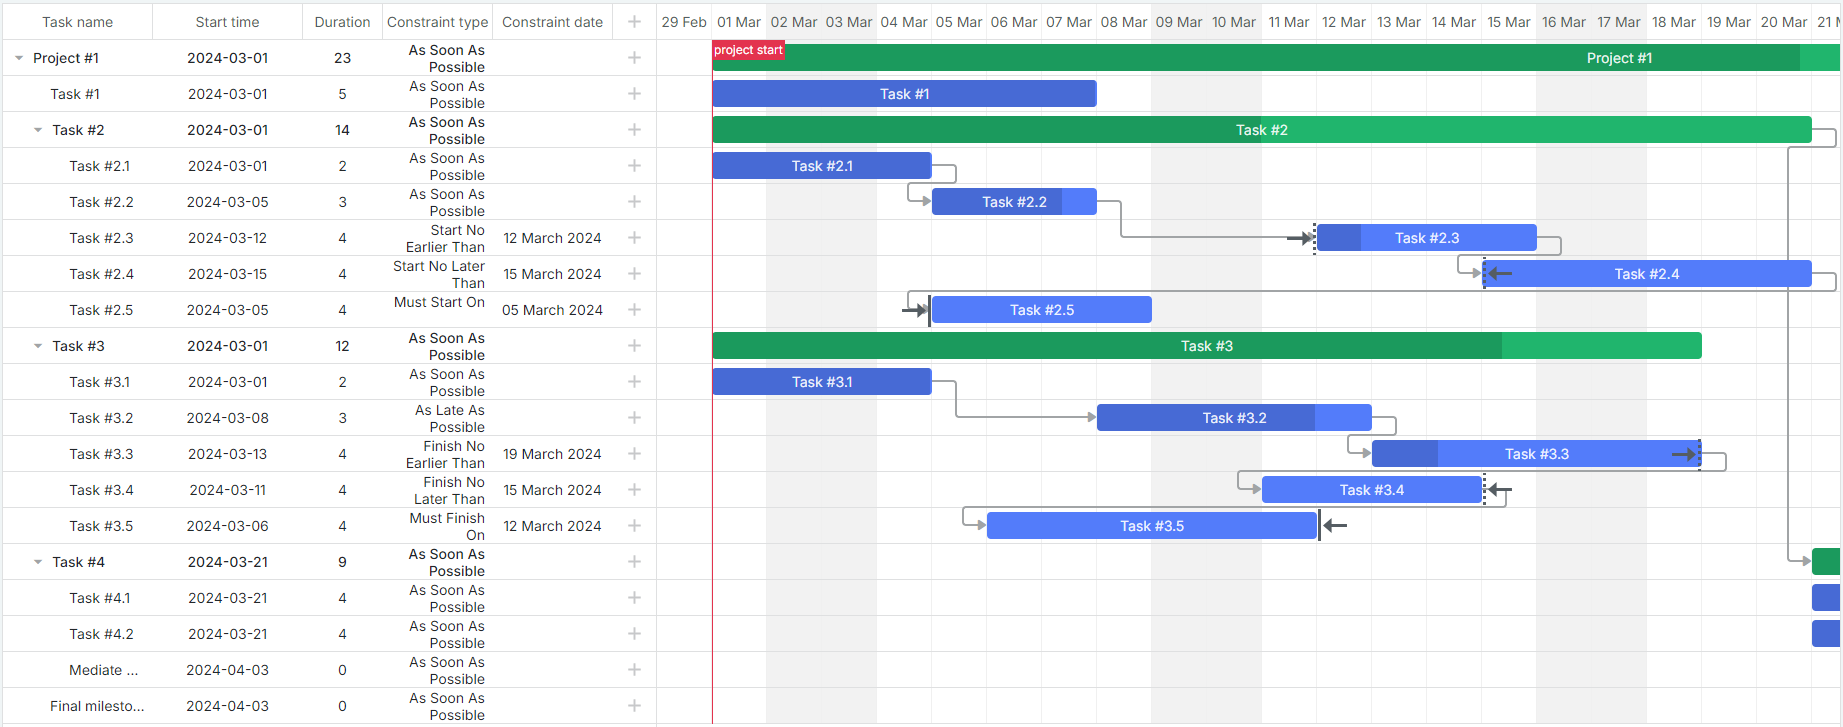
Starting from v9.0, when the constraint mode of auto-scheduling is enabled, Gantt will display constraint elements directly in the timeline. This feature is aimed at identifying tasks with specific scheduling constraints, ensuring that dependencies and limitations are accounted for during the project planning.
 Check the sample >
Programmatically, this feature is enabled in the following way:
It can also be implemented using the extended version of the auto_scheduling config:
enabled: true,
show_constraints: true
};
With this addition, end-users can quickly confirm that specified task constraints work properly in the auto-scheduling mode.
Sticky Labels for Time Scales
When managing complex workflows within the Gantt timeline, it can be very useful to keep time scales visible. Otherwise, users may get confused and misinterpret deadlines or timeframes when time scale labels move off-screen.
To reduce the risk of such issues, DHTMLX Gantt 9.0 offers sticky labels for time scales, ensuring that labels follow the viewport and stay visible until they naturally scroll off. Sticky labels also ensure better readability and navigation through the Gantt chart.
By default, sticky labels are enabled for all scales where the width of the cell is significantly larger than the width of the label. It is possible to customize this behavior using the sticky property of the scale object:
- Set sticky: true to always enable sticky labels, regardless of the cell width.
- Set sticky: false to disable this feature for a specific scale.
Here’s an example of how sticky labels for time scales can be configured:
{ unit: "year", step: 1, format: "%Y", sticky: true },
{ unit: "month", step: 1, format: "%F", sticky: false },
{ unit: "day", step: 1, format: "%j" } // default sticky behavior
];
gantt.init("gantt_here");
Overall, sticky labels contribute to better workflow management and task organization in Gantt charts.
Migration Notes
Taking into consideration a wide range of theming and styling changes delivered in this major release, you may need to modify your existing code to seamlessly migrate to v9.0. Changes in themes could potentially conflict with any custom styles or overrides you’ve applied using previous versions of DHTMLX Gantt. For more information on the migration from older Gantt versions, check out this section.
If you encounter any compatibility issues, please don’t hesitate to contact our tech support team for assistance.
That’s it about the new features shipped in DHTMLX Gantt 9.0. You can look through all the novelties one more time by visiting the What’s New page.
We invite you to download a free 30-day trial version of DHTMLX Gantt to try all the new capabilities in your scenarios. Current customers can access the latest version through their Client’s Area.
We hope that this update will help you build more visually appealing and user-friendly Gantt charts and elevate your project management apps. We look forward to your feedback on this release. Please share your thoughts and experiences in the comments below.