Features of DHTMLX JS Gantt Library
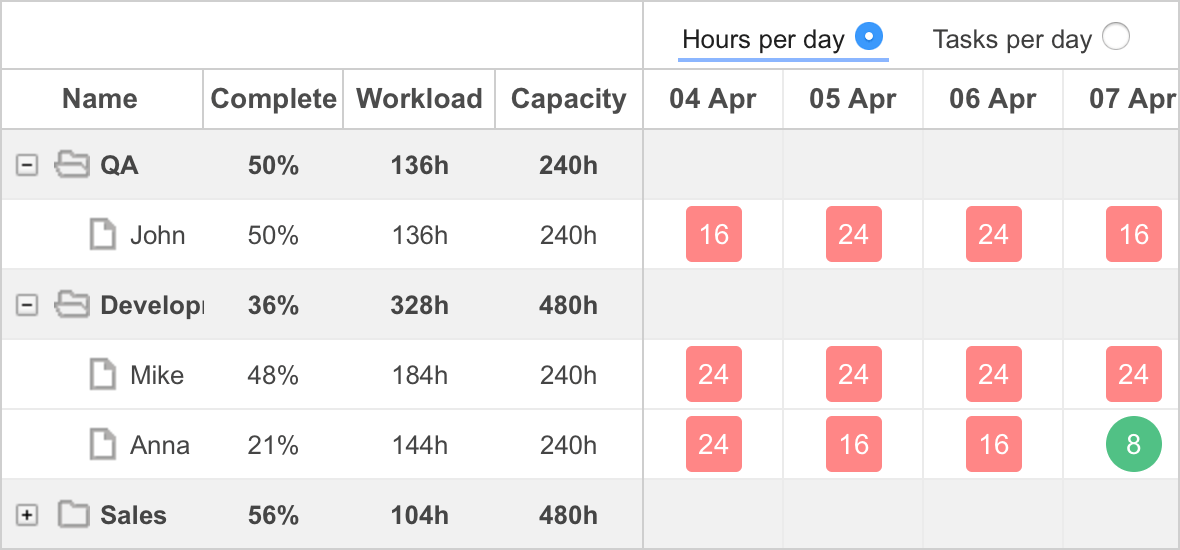
Resource management
With dhtmlxGantt PRO Edition you can assign resources (human, equipment, money, etc.) to the tasks and be able to estimate the workload of each separate participant of the project. Balance and manage the resources easily using resource diagrams.
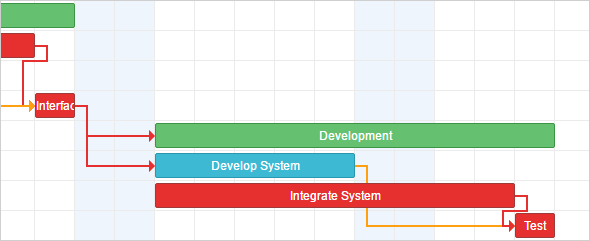
Critical path calculation
Each project management app requires feature for estimating risks and deadlines, and for these purposes critical path calculation is used. It allows you to estimate and display a sequence of tasks that can't be delayed or else the whole project would be delayed.
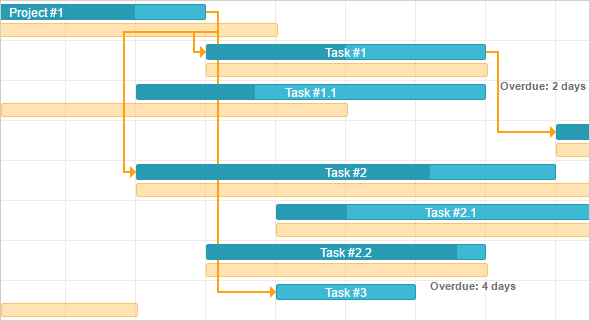
Support for baselines, deadlines and other custom elements
Set any additional elements to the timeline area. Apart from baselines and deadlines that you may find in our samples, there could be any custom elements that you need.
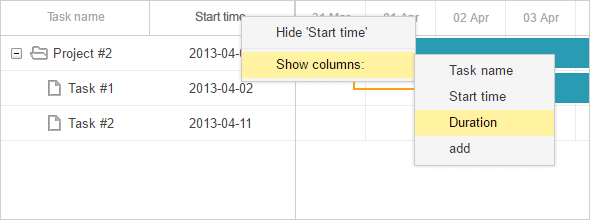
Simple API for hiding/showing columns of the grid and the ability to resize grid columns and the grid itself from the UI
Using the PRO version, you'll have the ability to add and remove columns from the grid part directly from the UI. You can also resize the columns width just by dragging its border. Please note that you have to use other DHTMLX libraries to implement this functionality.
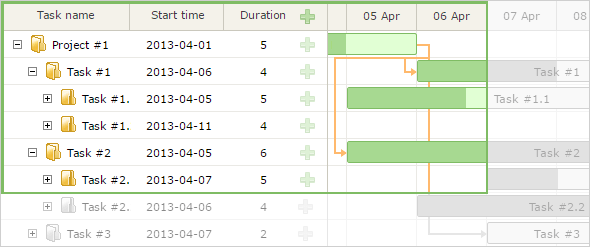
Dynamic loading
To increase the performance of your Gantt Chart, you may enable dynamic loading mode to make the tasks load level by level as the user scrolls the page.
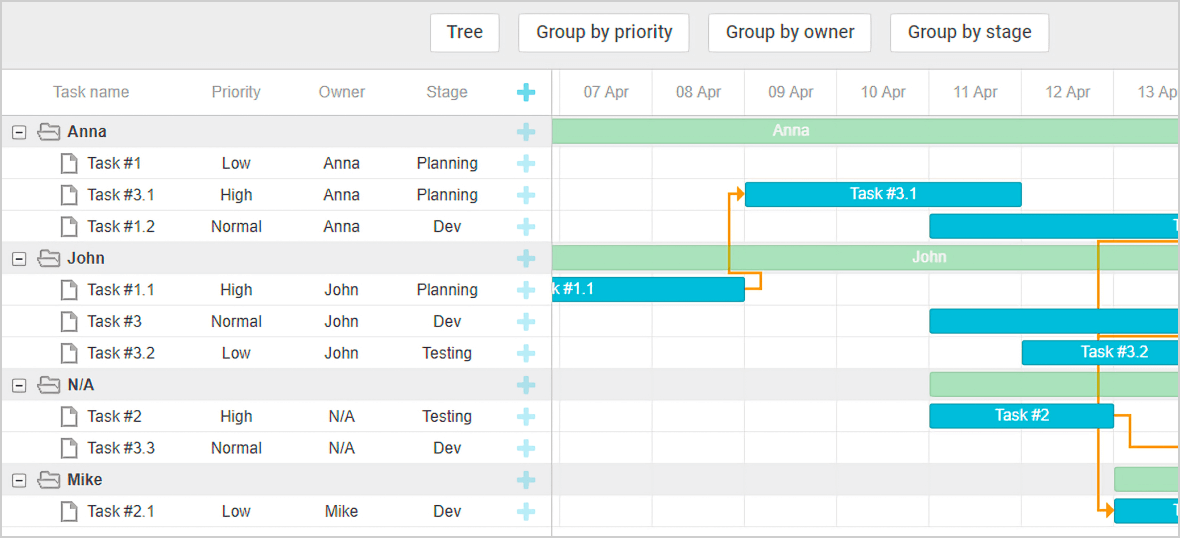
Tasks grouping
Group the tasks in dhtmlxGantt by any property. For example, grouping the tasks by owner, you'll see the workload of all team members.
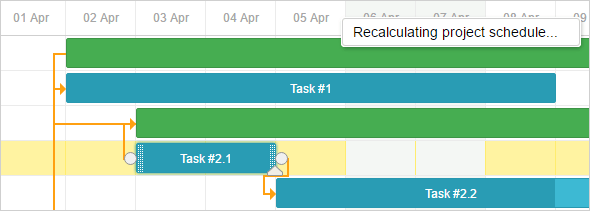
Auto scheduling
This feature allows you to navigate the project without setting the specific dates of each task as the tasks are scheduled automatically based on dependency links between them.

Project and milestones task types
PRO Edition allows you to unite tasks into Projects that will have the duration of all the child tasks. Milestones can be used to indicate some specific and important dates in the project.

Split Tasks
Splitting tasks is an ability to divide tasks into subtasks and switch between the 'split mode' and 'tree mode' of task display whenever needed, what gives much more flexibility in task management.

Setting Task Types Automatically
Editing gantt chart contents is much faster and easier with an ability to set task types automatically. The component knows when to convert subtasks into projects and projects with no subtasks into tasks while end users are in the process of editing their gantt chart.
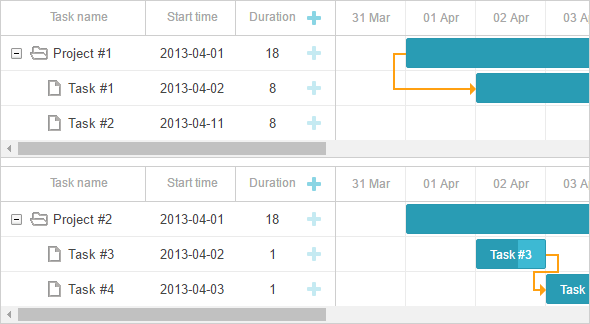
Ability to place several Gantt Charts on the one page*
If you need two or more Gantt charts on one page, use this PRO feature and manage several projects with different data in it.
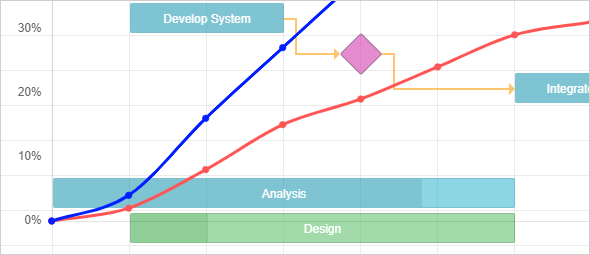
Showing custom content atop Gantt (e.g. S-curve)
Our library allows you to add any content you need on top of Gantt. For example, you can create a special layer with an S-curve for illustrating changes in resources like an increase in expenses or overall progress of your project.
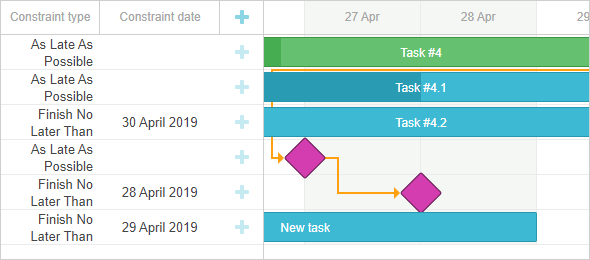
Tasks constraints
Apart from common task dependencies, there are additional constraints that you can put on separate tasks in order to manage the project's schedule. Tasks' constraints are divided into 8 types: as soon as possible, as late as possible, start no earlier than, start no later than, finish no earlier than, finish no later than, must start on, must finish on.
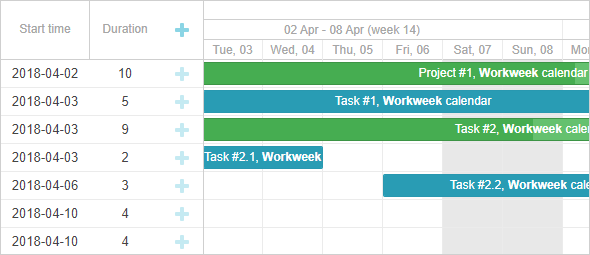
Working calendar for the whole project
Our Gantt chart enables you to define a working calendar not only for a separate resource but also for the whole project. Thus, a task will inherit the calendar of its parent-project if there is no other working calendar defined for it.
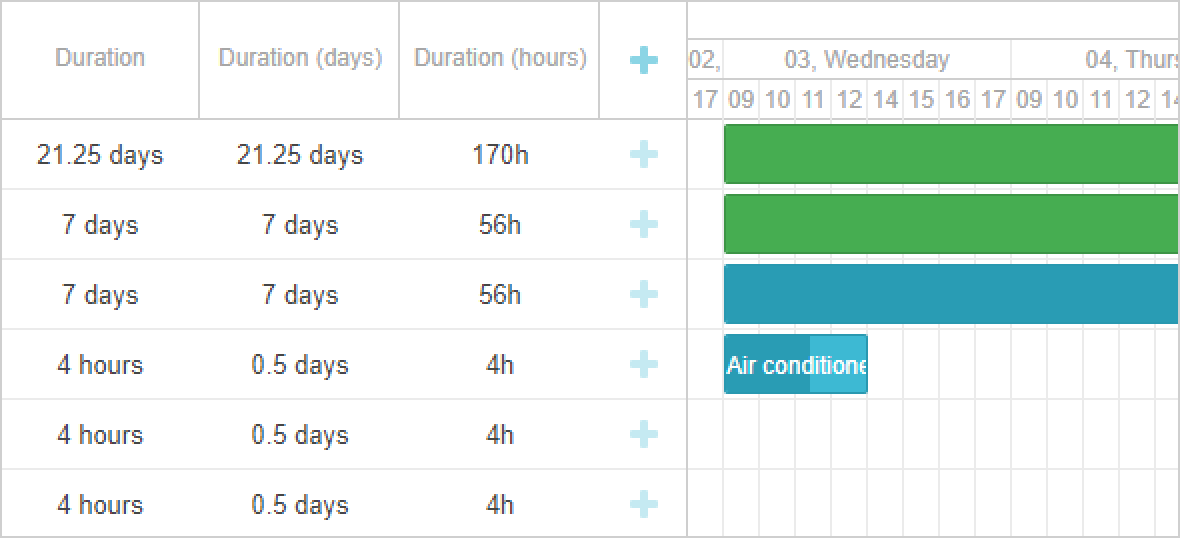
Decimal format of task duration
DHTMLX Gantt enables you to specify task duration not only in whole numbers but in decimal numbers as well. Moreover, Gantt converts duration from one unit to another on the fly - for example, from days to hours.
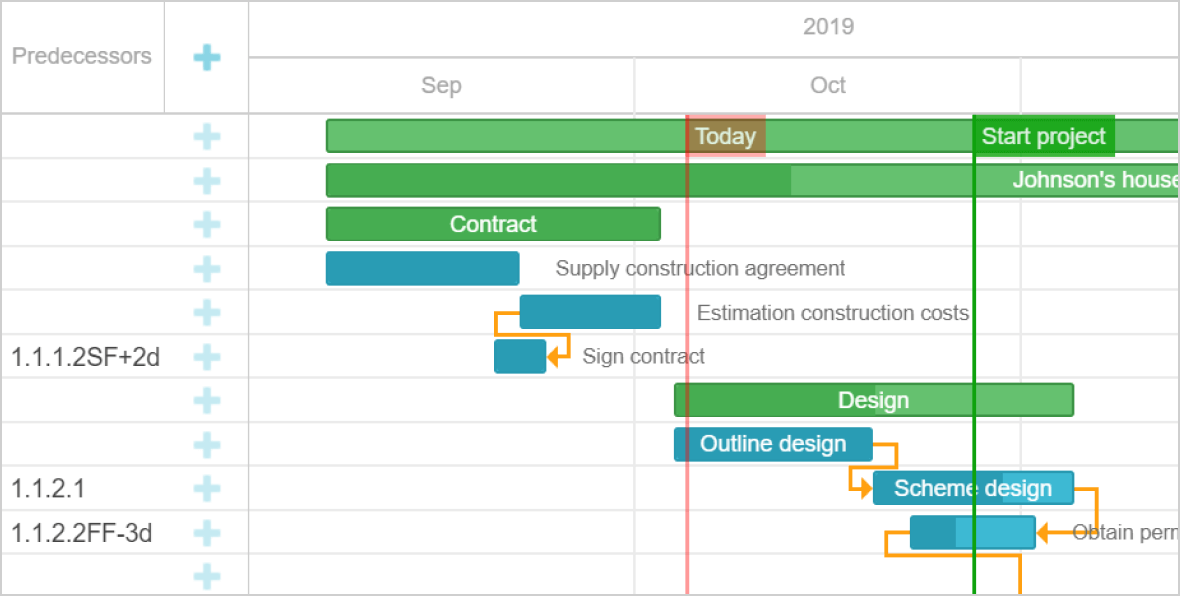
MS Project-like format of task dependencies
You can apply universal MS Project link formatting to define dependencies between tasks. For example, "1F+2d" means that the next task should start in 2 days after the first task finishes.
PDF/PNG export module
By default, you can export DHTMLX Gantt charts to PDF/PNG as well as Excel and iCal via our online export service. However, if you have any security restrictions and need to abstain from using third-party services, the solution is deploying a local export module on your own server. This module is shipped free of charge together with the JS Gantt package under the Commercial, Enterprise, and Ultimate licenses. In case you have the Individual license, you can purchase it separately.
MS Project export module
DHTMLX Gantt also allows exporting and importing data to and from MS Project. Likewise PDF and PNG formats, you can benefit from an online export service to convert Gantt data to an MPP file. If you prefer exporting data locally and keeping data safely to yourself, you can install an MS Project local export module. It goes free of charge under the Enterprise and Ultimate license and can be bought separately in addition to the Individual or Commercial license of DHTMLX Gantt.
Node.js server module
DHTMLX Gantt has a separate build running in the Node.js environment. Its purpose is to conduct a variety of client-less calculations. It is crucial for synchronizing simultaneous user actions, scheduling tasks automatically on multiple devices, integrating Gantt into complex ERP and CRM systems, and whatnot. The build is shipped free of charge together with the Ultimate license. Otherwise, you can purchase it in addition to any other Gantt license.
Rich drag-and-drop behavior
Drag-and-drop functionality enables users to quickly change the start/end dates of the tasks and their duration as well as create new tasks directly in the timeline by clicking on an empty area to set the start date and dragging to the right to define its duration. You can forbid dragging of specific tasks, limit the area for dragging, set minimal task duration, and control the autoscroll behavior during tasks' dragging.
Multi-task selection
With dhtmlxGantt, you can apply different operations to multiple tasks at once. The multi-task selection feature allows choosing several tasks by holding Ctrl or Shift key and dragging selected items horizontally across the timeline. Moreover, you can add hierarchy to your project and transform tasks to sub-tasks and vice versa.
Inline editing
You can use built-in editors to allow your users to make any changes in the grid area. They will be able to create and update tasks, set connections between them, define the start and end dates, and modify task duration.

Setting working time in minutes
You can change the default working time measured in hours and days. Thus, your users will be able to specify their working period also in minutes, for instance, starting at 08:15 am and finishing at 12:45 pm.
Backward scheduling *
In addition to the default forward planning strategy, dhtmlxGantt users can set backward scheduling that helps them focus on their project's time frame. Backward planning implies that tasks are scheduled from the end of the project with a focus on the entire project's deadline.
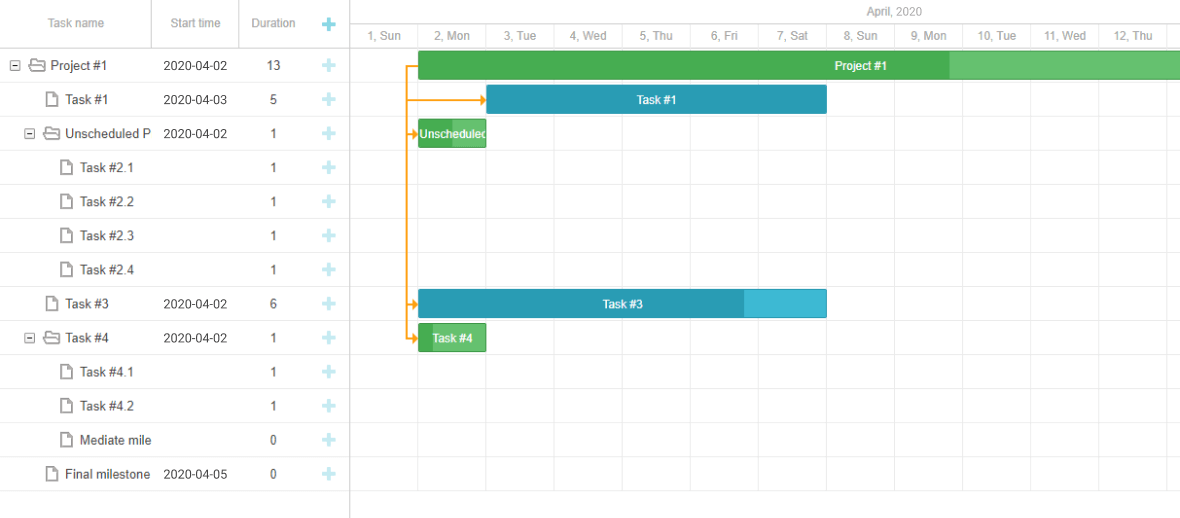
Support for unscheduled tasks *
With dhtmlxGantt, your users can add tasks without start and end dates. However, the system will assign default dates to these unscheduled tasks.
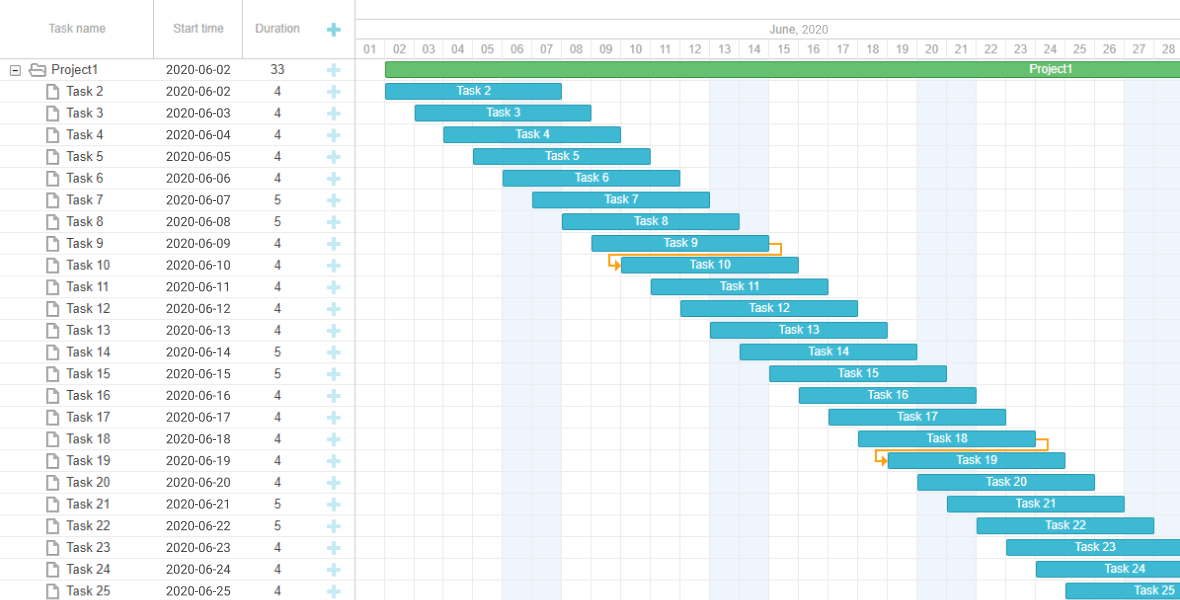
Smart rendering *
The smart rendering functionality allows significantly enhancing the speed of data visualization, especially while working with big data sets. This mode is responsible for rendering only the elements visible on the screen at the moment.
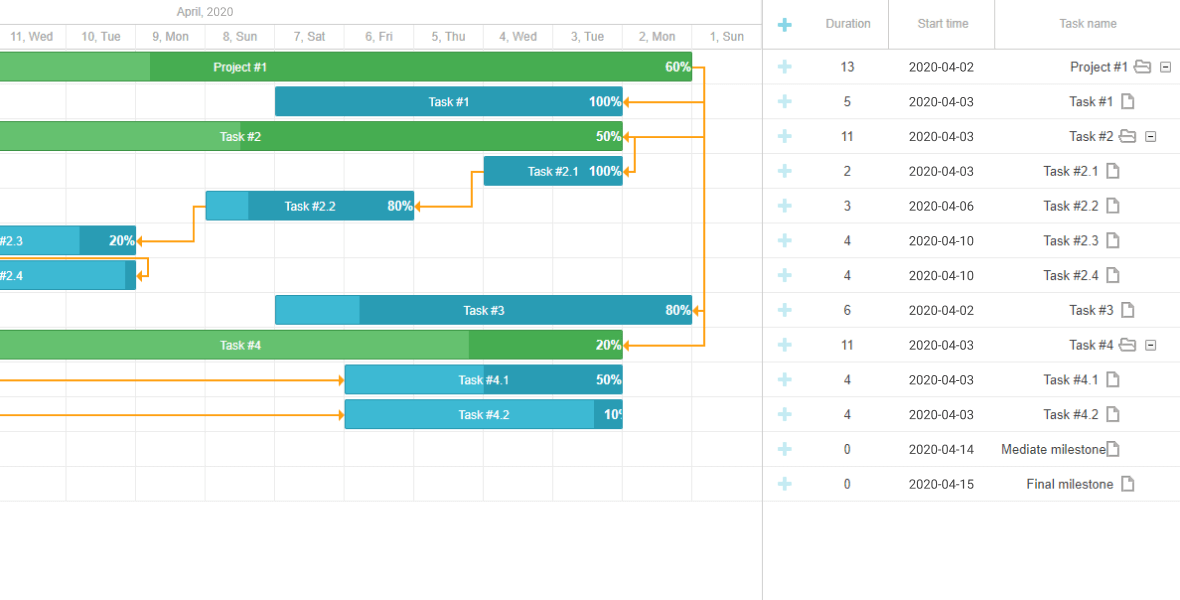
RTL mode *
DHTMLX Gantt library supports right-to-left rendering, thus allowing you to change the direction of the time scale in the timeline and the order of rows in the grid. All the chart elements will begin from the right and continue to the left side of the chart.
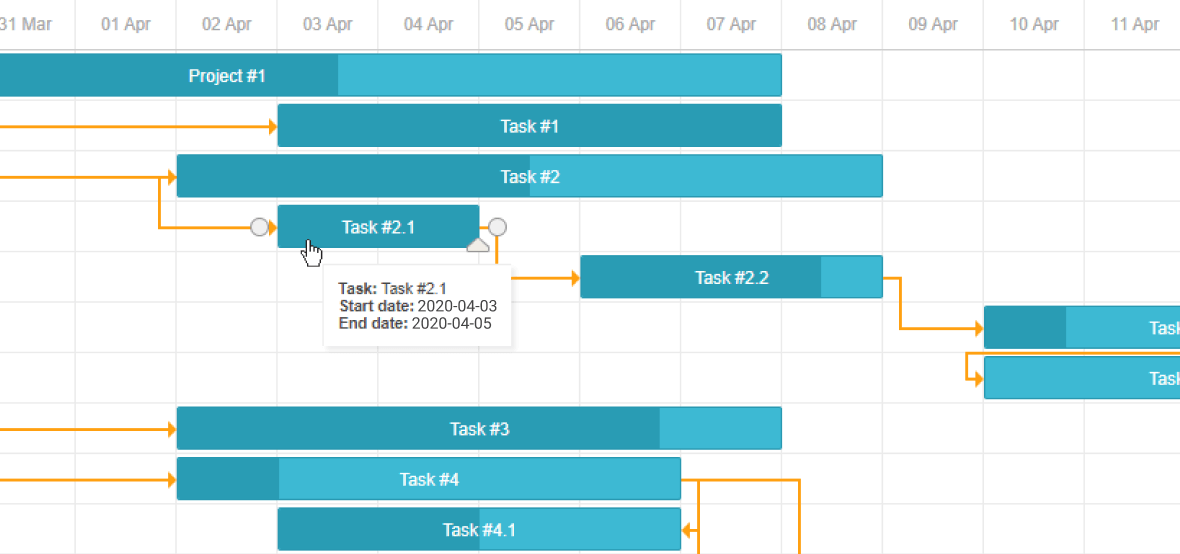
Tooltips
By default, tooltips are added to tasks, however, you can set a tooltip for any other Gantt elements. Tooltip behavior is completely customizable. You can configure the time of tooltips showing and hiding, change the position, and add custom text.
Tasks filtering
Our Gantt chart library supports client-side filtering. You can set filtration to display tasks with specific priority (e.g. high, normal, and low) or tasks assigned to a specific employee. Moreover, your Gantt chart may contain a text filter so users can type something and see only the tasks that match their search criteria.
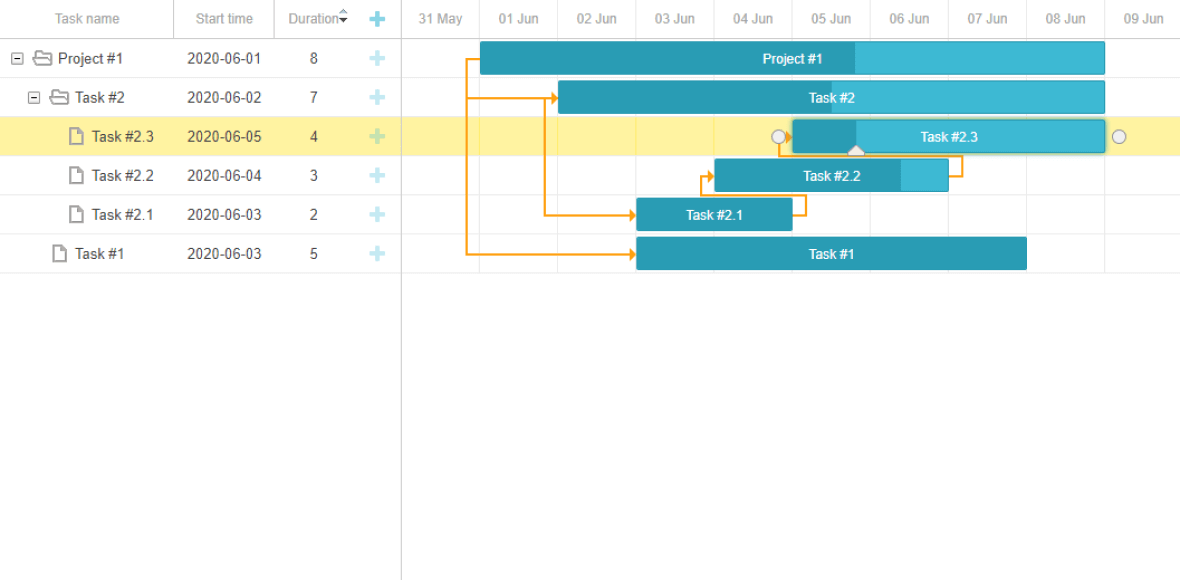
Sorting columns
You can enable your users to sort data in the grid. Once a user clicks on the header of a column, the Gantt chart displays a special control indicating the sorting direction. Each next mouse click on the header changes the sorting direction to ascending or descending. However, you can apply custom sorting functions.
Scrolling the timeline with the mouse *
With dhtmlxGantt, your users will be able to quickly scroll the timeline using mouse click and drag.
Keyboard navigation *
dhtmlxGantt includes keyboard navigation and provides access to all its elements via keys or key combinations. You can use ready shortcuts or create custom ones and attach different actions to different elements.
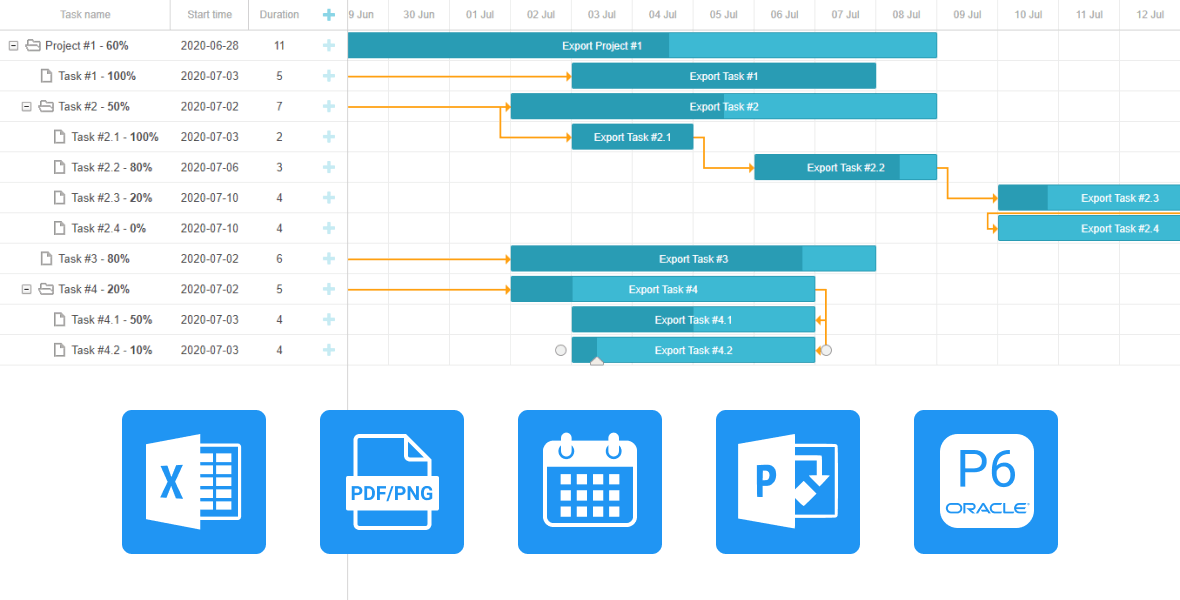
Multiple export/import possibilities
dhtmlxGantt library supports a large number of formats to export and import Gantt charts: PNG, PDF, Excel, iCal, MS Project, and Primavera6. By default, you can use a free online export service. The output PDF and PNG files will contain a DHTMLX watermark unless you buy a license. You can also export Gantt charts locally by ordering and installing a local export module on your computer.
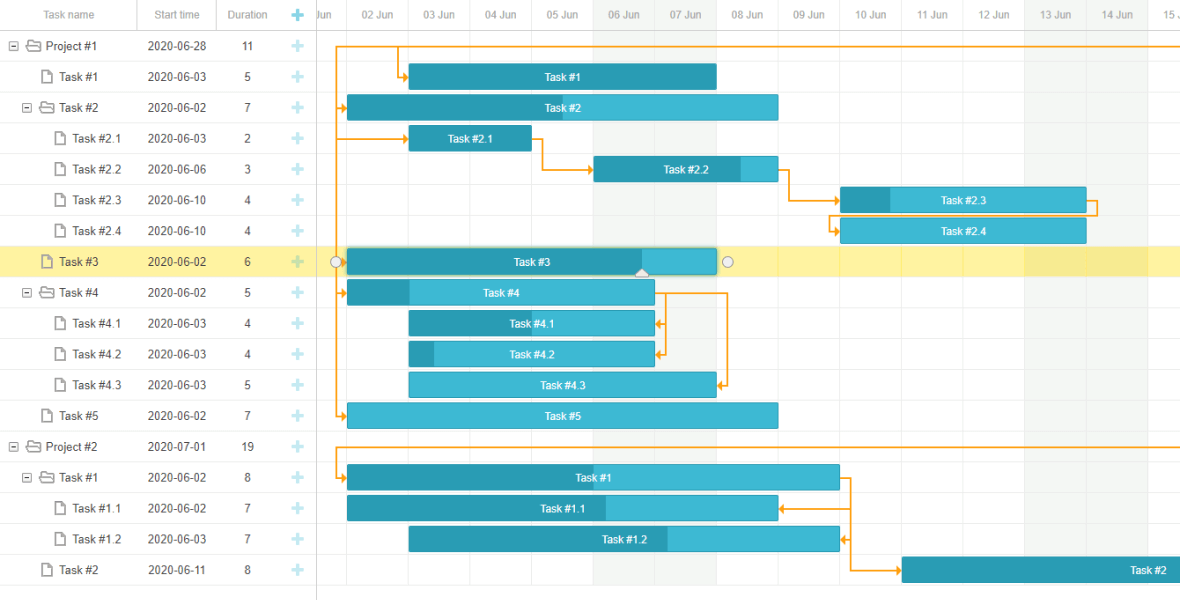
Highlighting specific time slots
To draw users' attention to specific timeline areas, you may highlight the cells. For example, you can mark weekends to visually divide the scale into weeks.
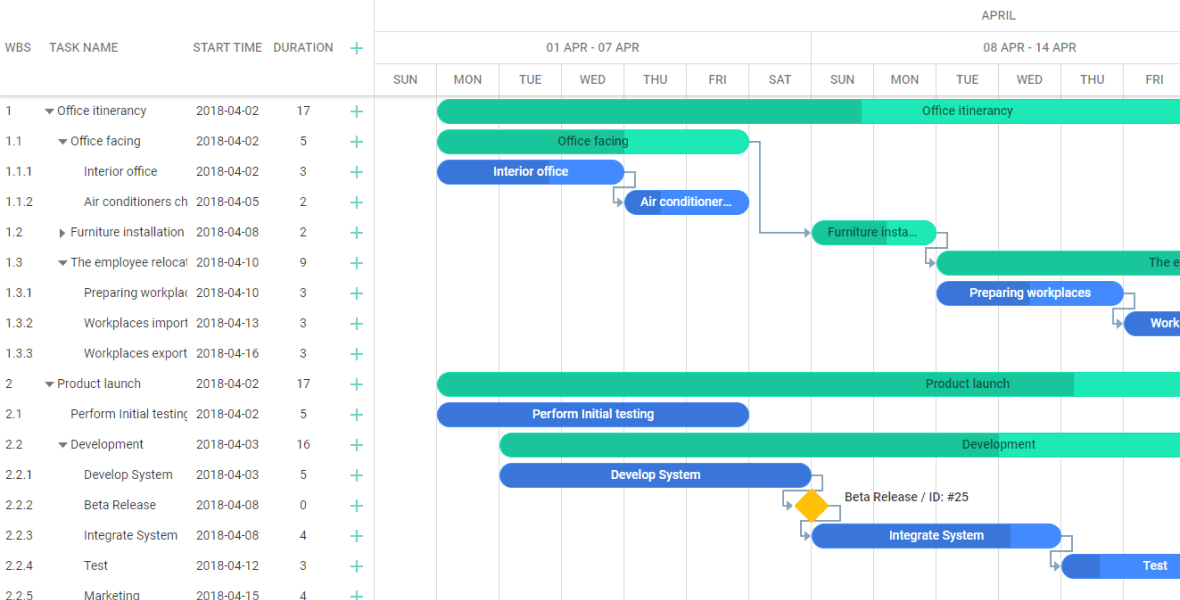
7 different skins *
dhtmlxGantt provides 7 predefined skins that you can use and customize according to your project needs. For example, you may apply the Material skin to change the overall look and feel of your Gantt chart.
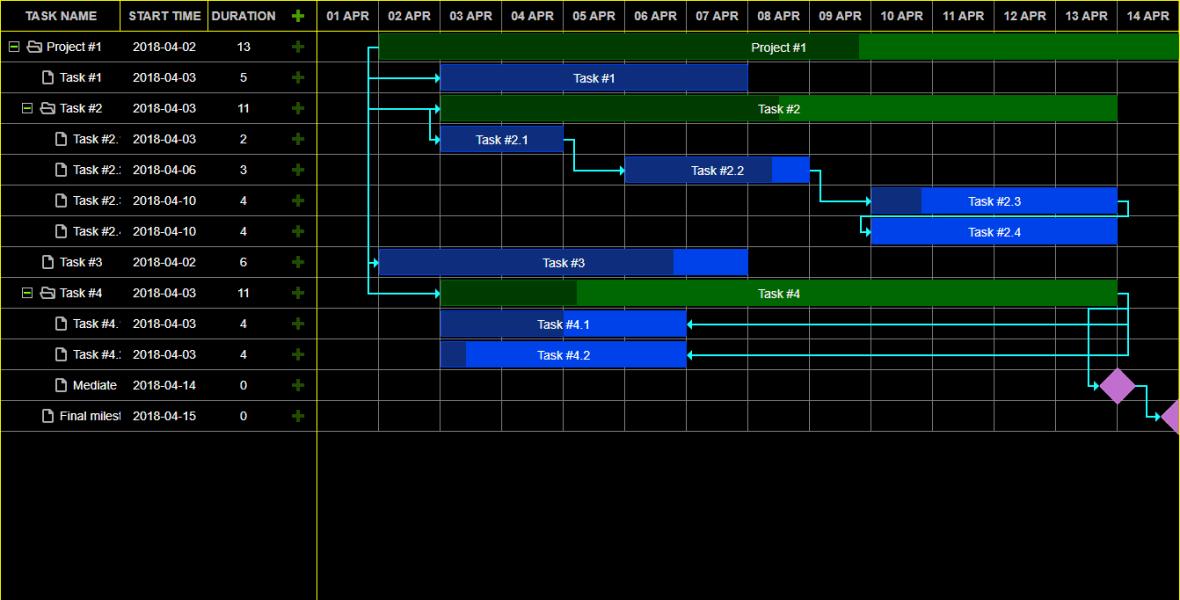
Accessibility *
To make easier access and interaction with DHTMLX Gantt for people with disabilities, you can use WAI-ARIA attributes, add keyboard navigation, and apply one of the high-contrast themes.

Try out dhtmlxGantt PRO Edition for Free
By downloading Gantt PRO trial, you get:
30 days of free evaluation
Extended functionality with PRO features
Opportunity to use Gantt Node.js server module
Official technical support
Complete technical guides and samples