Today we are thrilled to announce the release of DHTMLX Pivot 2.0. This major release is a turning point in the development of this product. Here we offer a renewed JavaScript Pivot table with the codebase overhaul, enhanced performance, and numerous new features.
Now, DHTMLX Pivot is much faster at rendering and generating extensive bulks of data. Our development team also prepared multiple configuration options for modifying the look and behavior of the main Pivot elements. For instance, Pivot columns can now be frozen and have a total column, collapsed and expanded states, and vertical headers. For pivot rows, we introduced adjustable heights and the ability to make all rows collapsible in tree mode. Additionally, v2.0 offers an opportunity to set limits for aggregated data and a range of new math methods to aggregate data more effectively and facilitate in-depth data analysis.
Let us tell you in more detail what to expect from DHTMLX Pivot 2.0.
Faster JavaScript Pivot for Immense Data Sets
Tools like a Pivot table are commonly used in data-driven web applications, where performance plays a crucial role. That is why the new iteration of our JavaScript Pivot comes with a significant speed improvement when working with huge data sets. Using this sample, you can test how fast our Pivot can generate and render datasets with up to 1 million rows. This measure guarantees that our JS Pivot handles and processes large volumes of data without lagging or any other performance issues.
New Configuration Options for Columns
Columns are a key structural element of any Pivot table. They play a vital role in organizing, categorizing, and presenting data. In DHTMLX Pivot 2.0, this element becomes more configurable thanks to several new features. Let us take a closer look at these novelties.
Frozen Columns
Starting from v2.0, it is possible to freeze the leftmost columns of the Pivot table, thereby maintaining their visibility during scrolling. This feature can be helpful when end-users need to keep columns with some essential benchmark data visible while scrolling numerous data. This way you maintain context for analyzing and comparing data without the need to constantly scroll back and forth.
To enable this feature, you need to use the split parameter of the tableShape property. In this parameter, you have to set the value of the left property to true.
tableShape: {
split: {
left: true //freezes all fields from rows on the left side
}
},
...
});
The number of split columns corresponds to the number of rows specified in the config property. You can also freeze an arbitrary number of columns from the left. Find more details on configuring frozen columns in this section of the documentation.
Collapsing and Expanding Columns
Large Pivot tables often contain so many columns that it may be hard to find necessary pieces of information at once. That is why we came up with the idea to enable end-users to expand and collapse a specific column with just a click on its header. This makes it easier to focus on relevant metrics or categories without being distracted by too much data. Also, end-users don’t have to scroll through extensive data to perform an effective side-by-side comparison of particular data segments.
To make columns collapsible, you have to change the value of the collapsible parameter in the headerShape property from false (default value) to true.
fields,
data: dataset,
headerShape: {
collapsible: true
},
...
});
Total Column
The updated DHTMLX Pivot allows adding an extra column with total values in the Pivot table. It nicely complements the already available total values option for rows in the footer (totalRow property in new API).
Programmatically, this feature is implemented via the new totalColumn parameter with the value set to true (false by default) in the tableShape object.
tableShape: {
totalRow: true,
totalColumn: true
},
...
});
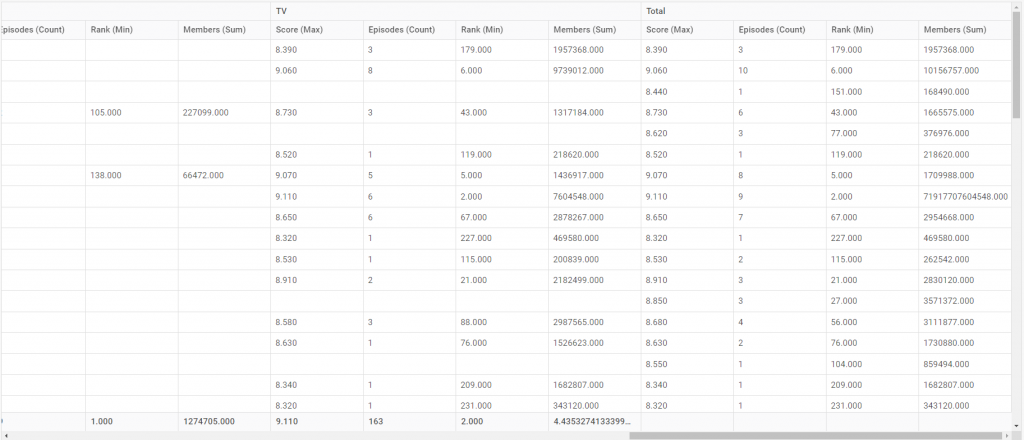
Thus, end-users get an additional layer of detail and convenience when working with tabular data. For instance, it allows quickly comparing individual row totals against column totals and get a more comprehensive data summary.
Vertical Headers
It is common to display text in headers of Pivot tables horizontally, but what if your text label is too long? Of course, it can be truncated or wrapped, but there is a better solution. In v2.0, we added the possibility of switching the text orientation in all headers from horizontal to vertical. Vertical headers help maintain a compact design in tables with many columns and ensure better readability.
You can do it in the code by changing the value of the vertical parameter in the headerShape property from false (default value) to true.
fields,
data: dataset,
headerShape: {
vertical: true
},
...
});
With these three new features, Pivot tables created with DHTMLX become more visually appealing and easier to interpret.
New Ways to Modify Pivot Rows
In general, a Pivot table is a more sophisticated tool for data analysis than a grid or a spreadsheet structurally. So, if you decide to add a JavaScript Pivot table to your web project, you’ll certainly want to make it as convenient as possible for end-users. Therefore, this release also includes several features designed to enhance the overall experience with Pivot tables built with DHTMLX.
Adjustable Size for Table Rows
The new version of our Pivot component is also notable for a more flexible approach to configuring the dimensions of your Pivot table. In addition to the already available option for manipulating the width of columns (colWidth in new API), it has become possible to adjust the height for rows, headers, and footers to specific requirements.
For this purpose, you should use the tableShape property with the sizes parameter, where you can specify such optional size attributes as rowHeight, headerHeight, footerHeight, and colWidth.
Here is how it works in practice:
fields,
data: dataset,
tableShape: {
sizes: {
rowHeight: 24,
headerHeight: 24,
footerHeight: 24,
colWidth: 220,
},
...
});
As a result, end-users can expect optimized data presentation and improved usability.
Collapsing and Expanding All Rows in Tree Mode
DHTMLX Pivot allows presenting data in a hierarchical format (tree mode) with expandable rows. Taking into account that Pivot tables usually include a large number of rows, it can be great to be able to expand and collapse all rows at once. And we added this feature in v2.0.
Now, we highlight how it works under the hood.
First, you enable the tree mode using the corresponding parameter in the tableShape property:
tableShape: {
tree: true
},
...
});
To make all tree branches expand or collapse by default, you can iterate all the rows in the resulting data before it renders and open or close them by setting the open parameter to true or false respectively.
const table = api.getTable();
api.intercept(“render-table”, ev => {
ev.config.data.forEach(r => (r.open = false));
});
You can also change the state of the branches dynamically like in the example below, where all rows get expanded or collapsed with the button click.
table.exec("open-row", { id: 0, nested: true });
}
function closeAll() {
table.exec(“close-row”, { id: 0, nested: true });
}
This feature contributes to faster interaction and analysis of large datasets.
As you can see, your JS pivot tables can be complemented with new features that make the work with data more convenient and productive.
New Data Aggregation Capabilities
Data aggregation is a core functionality of DHTMLX Pivot. In practice, it is the process of transforming complex data into concise and summarized formats, making it easier to analyze and derive meaningful insights. In version 2.0, you can benefit from some new features focused on data aggregation.
New Default Math Methods
Previously, DHTMLX Pivot provided a set of predefined methods for performing basic math operations on raw data and transforming it into meaningful insights. In v2.0, we expanded the list of default math methods with 9 new options to perform more complex calculations.
Some of these methods are well-suited for working with both text and numeric values. For instance, now you can count the number of unique values in a certain list (countunique) or the number of non-empty cells regardless of their content (counta).
There are plenty of new statistical methods that allow you to calculate the average, median, product, standard deviation, and variance of numeric values.
You can get acquainted with all the new default math methods of DHTMLX Pivot 2.0 in this section of the documentation.
Limiting Aggregated Data in Pivot Table
Besides the overall performance improvement mentioned above, our team implemented one more feature aimed at making DHTMLX Pivot even faster. From now on, it is possible to limit the dataset to be processed by the Pivot table.
How will it affect the Pivot’s performance? Aggregating only a part of the data will help reduce memory consumption on the devices of end-users and you can be sure that your app won’t shut down because of huge datasets.
To do that in your JS Pivot table, you’ll need to apply the limits property. It takes three optional parameters that specify when data rendering should stop:
- rows – max number of rows (10000 by default)
- columns – max number of columns (5000 by default)
- raws – max number of source data rows before grouping (infinite by default)
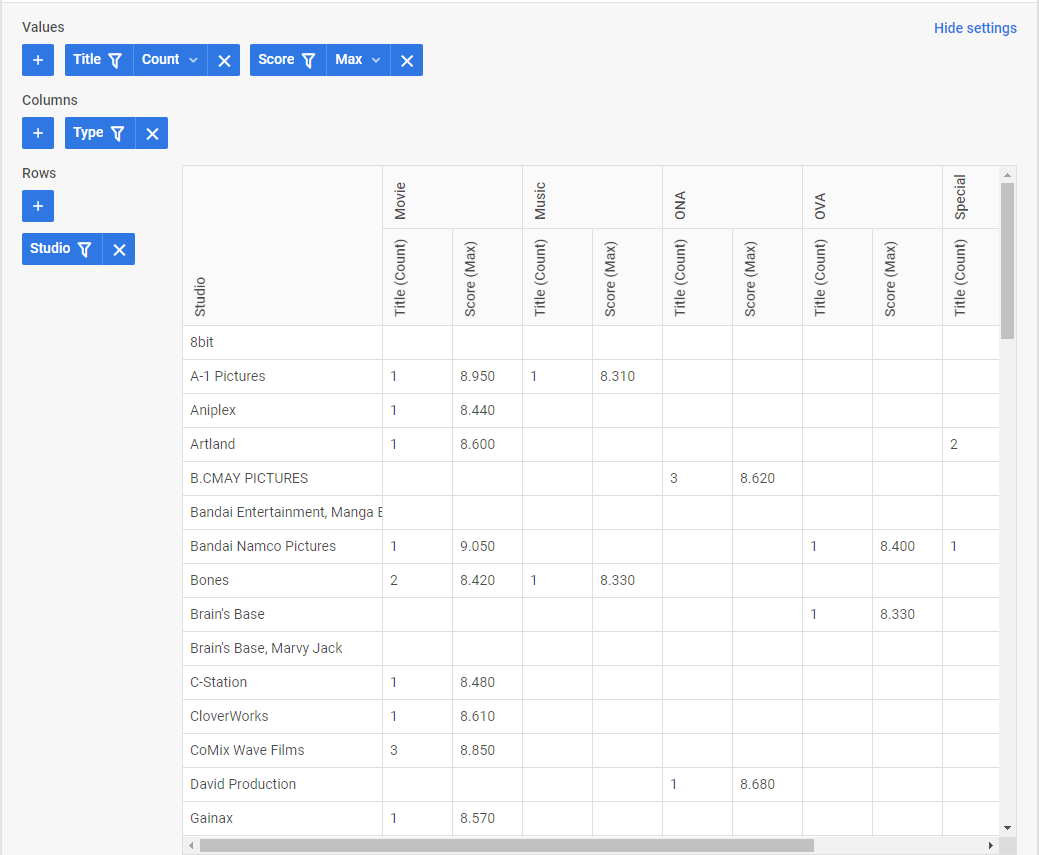
It should be noted that the limits are approximate values and they are applied on the basis of the rows/columns specified during the configuration. In the example below, it is specified that the content can take 3 columns and 10 rows.
fields,
data: dataset,
config: {
rows: [
"studio"
],
columns: [ "genre" ],
values: [
{
field: "title",
method: "count"
},
{
field: "score",
method: "max"
},
],
},
limits: { rows: 10, columns: 3 }
});
This feature can help in enhancing performance, improve user experience, and optimize data analysis.
Migrating from v1.5 to v2.0
It should be taken into account that the API of the new DHTMLX Pivot 2.0 is not compatible with the API of the previous stable version (1.5). There is a list of breaking changes associated with the migration from v1.5 to v2.0. You can find the full list of changes on the Migration page. You can apply this converter prepared by our dev team to ensure automatic data migration from v1.5 to v2.0.
That’s all about the main novelties delivered in this major update. For complete information, please refer to the “What’s new” section.
As usual, you can test all the new capabilities of the updated product right now by downloading a free 30-day trial version of v2.0.
For our existing clients, the latest version of DHTMLX Pivot is available in their Client’s Area.