JavaScript Pivot Table - Rapid and Powerful Data Summarizing and Reporting
Improve your business intelligence by visualizing your complex data with our high-speed JavaScript/HTML5 Pivot component. It helps you to summarize large data sets in a convenient way.
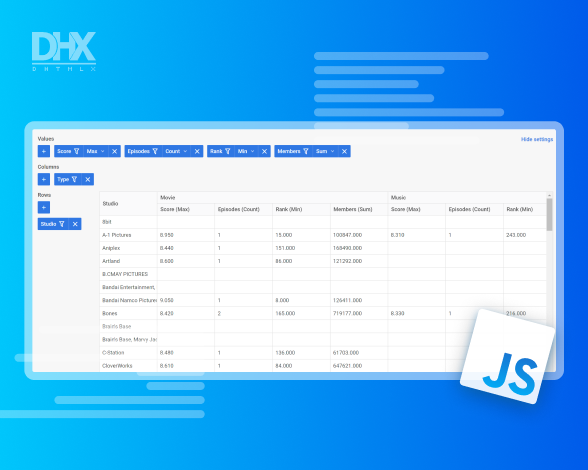
Open a demo on desktop


With DHTMLX Pivot, you get a user-friendly table to
manage large data sets quickly and conveniently.


Upgrade Your Data Analysis App with DHTMLX Pivot
Performing math methods for data aggregation
DHTMLX Pivot provides predefined methods for performing basic
and more complex math operations on input data. They help to
find the minimum or the largest values, calculate the average,
or display the sum of the selected data. Some of the methods
can be applied both for text and numeric values, e.g.
countunique for counting the number of unique
values in a certain list.

User-friendly operations with columns and rows
DHTMLX Pivot allows for intuitive data manipulation and analysis.
Sorting and filtering options are readily accessible, enabling
end-users to focus on specific subsets of data. It's possible to
freeze columns and rows and collapse/expand specific columns and
rows thus making it easier to work with large data sets.
Excel export module
By default, you can export your pivot table to the XLSX and CSV
formats using online export services. Besides, you have an option
to get your own export module and install it on your server. We
also provide all updates and fixes to the export service along
with free annual support.
Custom HTML templates for cells
The latest DHTMLX Pivot update introduces enhanced customization with templates,
enabling developers to apply custom HTML content in header and body cells. Additionally,
you can dynamically modify the table configuration using predefined templates for greater
flexibility.
Customizable built-in theme
DHTMLX Pivot JavaScript component comes with a built-in Material
theme. However, you can customize the default theme and change the
appearance of the pivot table by applying the corresponding CSS
variables. The following example shows how to modify the background,
icon, and border colors.
How to Start with DHTMLX Pivot
Build your first JavaScript Pivot table with 5 simple steps:
1.
Create an HTML file
2.
Include the Pivot js and css source files in the header
3.
Add a container with an id - e.g. “container”
4.
Initialize the widget with the dhx.Pivot object constructor
5.
Specify Pivot structure, fields, and other configuration properties you need
Click to copy
Key Features of the JavaScript/HTML5 Pivot Component
Pure JavaScript library, easily integrated with any server side
No 3rd party dependencies
Extensive API to configure it for any needs
Cross-browser and cross-platform support
Convenient filtering and sorting
Custom and preset data operations
Customizable look and feel
Collapsible columns
Expanding and collapsing rows
Setting limits on loaded data
Why Choose DHTMLX Pivot?
Lightning-fast data rendering
Our JavaScript pivot grid component provides fast performance with large data sets.
It's an important benefit for business applications where you need to work with
hundreds and thousands of records. DHTMLX Pivot renders a considerable amount of
data equally well in all web browsers.
Configurable UI
The Pivot appearance is fully configurable. All the elements of JavaScript/HTML5
Pivot table layout can be adjusted according to your needs. There is a set of
attributes that you can use to modify the look and feel of your table in the blink
of an eye.
Flexible customization
DHTMLX Pivot supports styling via CSS variables. As an example, you can highlight
min and max values of the cells by different colors. Besides, you can add any
custom content to the cell that you need like checkboxes and other elements.
Support for Angular, React, and Vue.js
The JavaScript Pivot component can be integrated with the most widely used
client-side frameworks. Integration with Angular, React, and Vue.js is smooth
and requires just a few quick steps described in our guides.
Fast learning and initialization
Due to simple initialization, which takes just a few steps, the DHTMLX Pivot
grid has an extremely short learning curve that significantly increases the
development speed.
DHTMLX Pivot Licensing
|
Individual
Total: $299
|
Commercial
Total: $499
|
Enterprise
Total: $749
|
Ultimate
Total: $1499
|
| License Terms | Read License Agreement | Read License Agreement | Read License Agreement | Read License Agreement |
| Developers | 1 | 5 | 20 | |
| Projects | 1 | 1 | 5 | |
| Use in SaaS (unlimited end-users) | ||||
| Perpetual distribution rights |
|
Support Plan
|
Standard | Premium | Premium | Ultimate |
| Time Period | 1 year | 1 year | 1 year | 1 year |
| Updates | Major, minor, and maintenance updates | Major, minor, and maintenance updates | Major, minor, and maintenance updates |
Major, minor, and maintenance updates
Priority queue for bug fixing
|
| Support requests | 10 | 30 | 50 | |
| Response time | 72h | 48h | 48h | 24h |
| Personal Account Manager |
|
Functionality
|
PRO | PRO | PRO + 1 add-on | PRO + 1 add-on |
| Online export to Excel | Free | Free | Free | Free |
| Free local Excel export module |
Unlock up to 65% Savings with DHTMLX Bundles


Documentation
Consult the documentation
Explore the Pivot documentation with detailed API descriptions and step-by-step
guides and tutorials. It also provides instructions for seamlessly integrating the
pure JavaScript component with Angular, React, and Vue.js frameworks.
Samples
Discover code snippets
Use our flexible code snippet tool to create and configure pivot data tables online.
Explore various code possibilities and share customized examples with your team or
DHTMLX support.
Free trial
Download Pivot free trial
Assess the features of DHTMLX Pivot by downloading the free 30-day trial version. It
includes the latest updates and provides access to the official technical support.
Official tech support
Learn about technical support
Read about the available methods for obtaining technical or licensing support. The
DHTMLX team assists both proprietary license holders and trial users.
Community forum
Use DHTMLX forum
Discover solutions in the knowledge base shared by DHTMLX users and benefit from the
experiences of skilled developers. We monitor discussions and address frequently asked
questions.
Blog
Keep up with Pivot updates
Dive into the DHTMLX blog, a comprehensive resource that provides the latest updates
on the JavaScript Pivot component, detailed feature descriptions, helpful tips, and
technical tutorials.
DHTMLX Pivot: Frequently Asked Questions
General
Working with Data
Configuration and Styling
Integration
Export / Import
Licensing and Support
General
What is DHTMLX Pivot and how does it work?
DHTMLX Pivot is a JavaScript pivot table component for interactive data analysis in web apps. It works by taking structured data, aggregating it by rows, columns, and values, and rendering an interactive pivot table UI. Users can configure values, apply aggregations, and analyze data dynamically in the web app.
What are the main features of DHTMLX Pivot?
A JavaScript pivot table features multiple aggregation functions, filtering and sorting, large dataset support, export to Excel/CSV, API-driven control, UI customization, and seamless integration with modern frameworks.
How is DHTMLX Pivot different from other JavaScript pivot table libraries?
While the JavaScript pivot table library comparison market includes various options from basic free libraries to specialized tools, DHTMLX Pivot targets organizations that need scalability, reliability, polished UI, and ongoing technical support for enterprise-grade systems.
How does DHTMLX Pivot compare to open-source pivot table solutions?
When weighing open source vs commercial pivot table solutions, the choice ultimately depends on your project requirements, budget, and long-term needs. Compared to open-source pivot tables, DHTMLX Pivot offers better performance, official support, regular updates, and enterprise-ready features. Open-source tools are free to use but may lack scalability, documentation, or guaranteed maintenance.
Is DHTMLX Pivot suitable for enterprise web applications?
DHTMLX Pivot is designed for enterprise use. Organizations deploying an enterprise pivot table component need more than just functionality; they require accountability, predictability, and scalability. DHTMLX Pivot supports large datasets, provides a stable API, offers commercial licensing, and includes professional technical support. This makes it the ideal choice for finance, healthcare, logistics, and other sectors where reliability is a must.
How do I create a pivot table in JavaScript using DHTMLX Pivot?
You can create a JavaScript pivot table by initializing the DHTMLX Pivot component, defining a container, loading data, and configuring rows, columns, and values. The setup is done through JavaScript configuration objects and API calls.
Is DHTMLX Pivot a part of DHTMLX Suite?
No, DHTMLX Pivot is not a part of the DHTMLX Suite library. DHTMLX Pivot is a separate, standalone component developed by DHTMLX. Although it integrates well with Suite UI widgets and follows a similar design and API style, it is not bundled with the Suite and requires a separate license.
Working with Data
How can I filter, sort, and group data in a JavaScript pivot table?
DHTMLX Pivot delivers robust JavaScript pivot table filtering and sorting capabilities through built-in UI controls. Users can apply filters interactively and explore data insights effortlessly, while developers can control behavior programmatically using extensive configuration options and methods.
What data aggregation functions are available in DHTMLX Pivot?
DHTMLX Pivot supports common aggregation functions such as sum, count, average, min, max, and custom aggregations for comprehensive data analysis within pivot tables. The library provides built-in aggregation methods that can be applied to numeric fields, enabling flexible data summarization and analysis in JavaScript applications.
Does DHTMLX Pivot support large datasets and high-performance data analysis?
DHTMLX Pivot table is optimized for large datasets in JavaScript apps. It efficiently processes and renders high-volume data, supports server-side integration, and minimizes UI lag, making it suitable for high-performance analytical scenarios.
How do I load data into DHTMLX Pivot from a JSON source?
The pivot table natively supports the load of JSON data. First, you have to prepare a JSON array of objects where each object represents a data row. You can load this JSON into DHTMLX Pivot by using the load() method with the JSON file path after initialization.
Configuration and Styling
What APIs are available to control DHTMLX Pivot programmatically?
DHTMLX Pivot comes with a feature-rich JavaScript pivot table API that allows developers to control the component programmatically. Using the API, you can load or update data, modify configuration settings, apply filters, change aggregation functions, refresh the pivot view, and handle user-driven events, enabling dynamic and fully interactive data analysis.
Does DHTMLX Pivot support drag-and-drop configuration?
Like many other JavaScript pivot table components, DHTMLX Pivot does not support the drag and drop pivot table functionality. However, you can configure the pivot table structure, including rows, columns, and values programmatically via configuration objects.
How can I customize the layout and appearance of DHTMLX Pivot?
DHTMLX Pivot is a customizable JavaScript pivot table that allows you to tailor its appearance using CSS and built-in configuration options. You can customize themes, colors, fonts, grid styles, headers, and UI elements to match your application’s design.
Integration
Can DHTMLX Pivot be used in React, Angular, or Vue applications?
DHTMLX JavaScript Pivot table can be integrated into React, Angular, and Vue applications using lifecycle hooks, allowing it to work smoothly within modern frontend frameworks. Explore the documentation to learn more about available DHTMLX Pivot integrations.
How can I integrate DHTMLX Pivot with server-side data processing?
DHTMLX Pivot table integrates with server-side data processing by loading JSON data through fetch requests in JavaScript. Use the native fetch method to retrieve data and fields from backend endpoints, then apply them using table.setConfig({data, fields}).
Export / Import
Can I export data from DHTMLX Pivot to Excel or CSV?
DHTMLX JavaScript Pivot table supports data export to Excel and CSV formats, making it easy to share or further analyze results outside the application.
Licensing and Support
What licensing options are available for DHTMLX Pivot?
DHTMLX Pivot table is available under a commercial license where you pay once and use forever. Licensed users receive regular updates, bug fixes, and professional technical support, making it suitable for enterprise and production-grade web applications.
Is there a free trial or demo version of DHTMLX Pivot available?
You can download a DHTMLX Pivot free trial from the official website. You’re free to evaluate DHTMLX Pivot within 30 days before purchasing a license.
Where can I find documentation and examples for DHTMLX Pivot?
Official DHTMLX Pivot documentation, API references, technical guides, and examples or code snippets are available on the DHTMLX website.
How do I get technical support for DHTMLX Pivot?
DHTMLX Pivot support is available through the technical support system, including email tickets, documentation, and direct assistance for licensed users. You can also visit a community forum to get answers from other DHTMLX users and our support team.


Send
a Question
a Question