JavaScript Charts Library
A versatile JavaScript/HTML5 chart library with unlimited customization and configuration possibilities.
Part of the Suite UI library based on Material design.
JavaScript Charts Library Features
- Line and Spline charts
- Bar and X-Bar charts
- Area and Spline Area charts
- Pie, Pie 3D, and Donut charts
- Radar charts
- Scatter charts
- Stacked charts
- Mixed charts
- Logarithmic scale
- Custom scale labels
- Custom templates for tooltips and labels
- Configurable legend
- Calendar heatmap chart
- Ability to hide scales and grid lines
- Ability to show a threshold line and baseline
- Various shapes of points and markers (circle, triangle, etc.)
- Data loading in the JSON format
- Rotation of scale and data labels
- Four axes
- Touch support
- TypeScript support
- Cross-browser compatibility
- Full control with JavaScript API
- Wide customization options
- Export to PDF/PNG
- Accessibility support
DHTMLX Suite Demos with JavaScript Charts
Key Features of DHTMLX Chart
Explore the functionality of the JavaScript charts library with the help of DHTMLX code snippets.
How to Initialize JavaScript Charts with DHTMLX
Dynamic Charts in JavaScript - Live Update
With DHTMLX Chart you are able to visualize the changes in data happening in real time.
Why Choose DHTMLX JavaScript Chart Library?
Build beautiful and interactive JavaScript charts
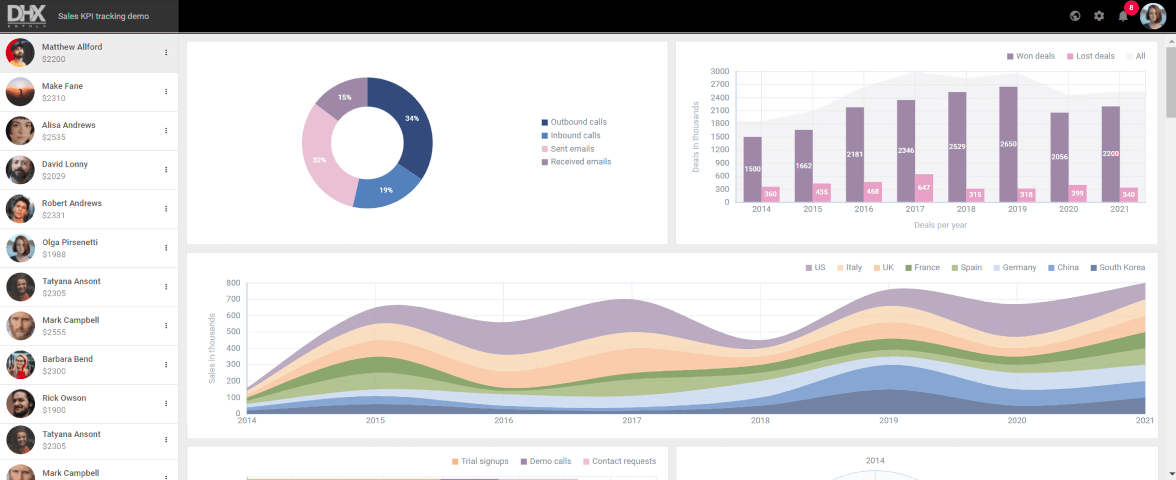
DHTMLX Chart library offers 12 types of JavaScript/HTML5 charts for visualizing data in web apps, including line, spline, area, bar, pie, donut, scatter, radar, treemap and heatmap charts. Each type caters for different needs. For instance, bar charts can display several data series, plotted separately side by side or stacked. Pie charts have 2D and 3D variations. You can also mix different chart types on a single chart (e.g. combine line and bar charts).
Equip your charts with all the necessary properties
A comprehensive JavaScript chart API makes it possible to achieve the desired configuration without a hitch. Scales, series, and legend are entirely modifiable. You can configure everything starting from titles and labels to min and max values of the Y scale. You can choose to show or hide grid lines or make them dashed, set a baseline and a threshold line for illustrating a target value, build a logarithmic scale, define the legend alignment, etc.
Customize the appearance to match your web app
There are endless opportunities for customizing charts from our JavaScript chart framework to meet your needs. You have a complete control over all paddings, margins, sizes, and colors of all elements. DHTMLX Chart enables you to create your own CSS classes with custom settings. You can apply a color gradient to bars, specify colors and transparency of the series filling, etc. Besides, you can set custom templates for tooltips and scale labels.
Integrate charts into your Angular, React, or Vue.js apps
Just like all other Suite components, our JS charts control can be easily integrated into web apps based on the most popular frameworks among developers: Angular, React, and Vue.js. Our development team created code examples to make the process of integration smooth. You are free to evaluate the work of the components during a 30-day trial period.
Support and Learning Resources for JavaScript Charting Library
Other Suite Widgets
DHTMLX Chart Licensing
| Individual | Commercial | Enterprise | Ultimate | |
|---|---|---|---|---|
| License Terms |
Individual
|
Commercial
|
Enterprise
|
Ultimate
|
| Developers |
Individual
1
|
Commercial
5
|
Enterprise
20
|
Ultimate
|
| Projects |
Individual
1
|
Commercial
1
|
Enterprise
5
|
Ultimate
|
| Use in SaaS (unlimited end-users) |
Individual
|
Commercial
|
Enterprise
|
Ultimate
|
| Source code |
Individual
|
Commercial
|
Enterprise
|
Ultimate
|
| Perpetual distribution rights |
Individual
|
Commercial
|
Enterprise
|
Ultimate
|
| Support Plan |
Individual
Standard Support
|
Commercial
Premium Support
|
Enterprise
Premium Support
|
Ultimate
Ultimate Support
|
| Time Period |
Individual
1 year
|
Commercial
1 year
|
Enterprise
1 year
|
Ultimate
1 year
|
| Updates |
Individual
Major, minor, and maintenance updates
|
Commercial
Major, minor, and maintenance updates
|
Enterprise
Major, minor, and maintenance updates
|
Ultimate
Major, minor, and maintenance updates
Priority queue for bug fixing
|
| Support requests |
Individual
10
|
Commercial
30
|
Enterprise
50
|
Ultimate
|
| Response Time |
Individual
72h
|
Commercial
48h
|
Enterprise
48h
|
Ultimate
24h
|
| Personal Account Manager |
Individual
|
Commercial
|
Enterprise
|
Ultimate
|
| Functionality |
Individual
Professional
|
Commercial
Professional
|
Enterprise
Professional
|
Ultimate
Professional
|
| Calendar heatmap chart |
Individual
|
Commercial
|
Enterprise
|
Ultimate
|
| Online export to PDF/PNG without watermark (Charts) |
Individual
Free for 1 year
|
Commercial
Free for 1 year
|
Enterprise
Free for 1 year
|
Ultimate
Free for 3 years
|
|
Individual
Total: $79
|
Commercial
Total: $159
|
Enterprise
Total: $359
|
Ultimate
Total: $719
|
of buying DHTMLX UI components separately:
Suite Individual - $799
Suite Commercial - $1699
Suite Enterprise - $3499
Suite Ultimate - $6999

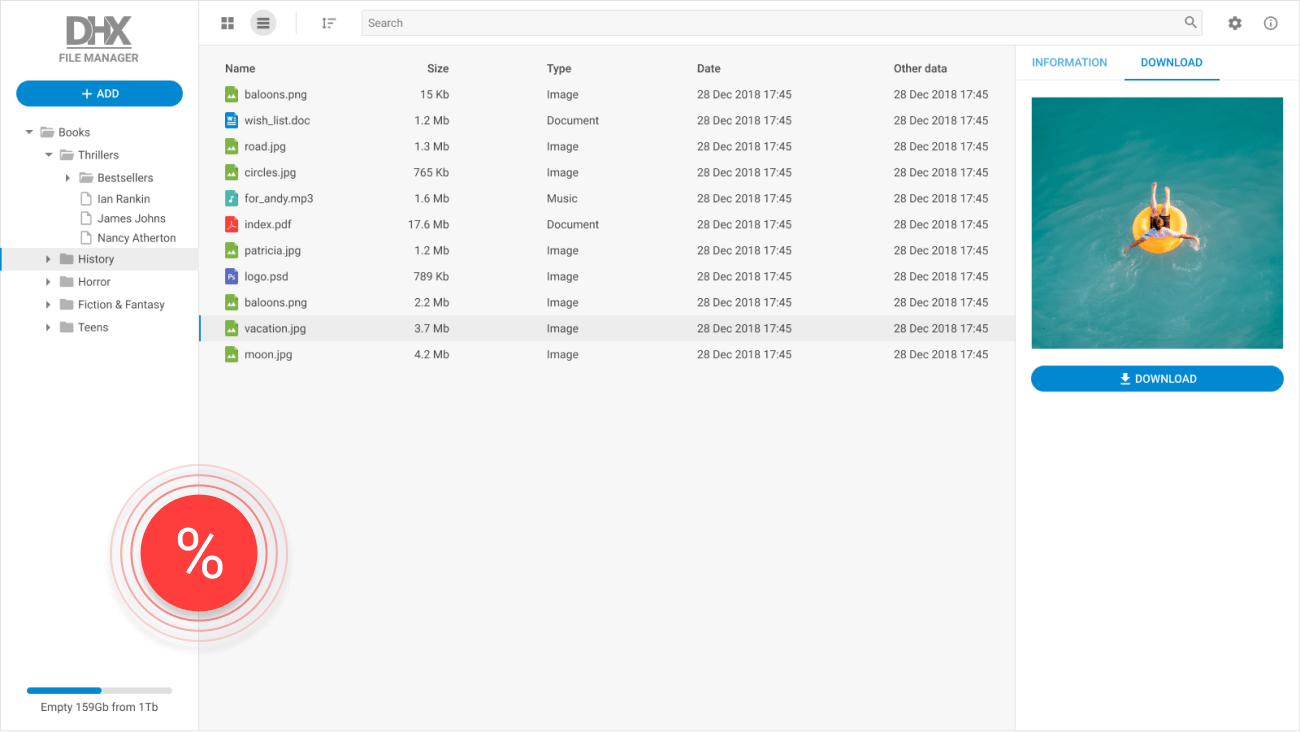
File manager built with the help of Suite components: Layout, Grid, DataView, Toolbar, etc.
Need help with DHTMLX Chart integration into your app? Contact us


